I can't make heads or tails what this means, so ask your competent? doctor for answers.
Lipidome changes due to improved dietary fat quality inform cardiometabolic risk reduction and precision nutrition
Nature Medicine (2024)
Abstract
Current cardiometabolic disease prevention guidelines recommend increasing dietary unsaturated fat intake while reducing saturated fats. Here we use lipidomics data from a randomized controlled dietary intervention trial to construct a multilipid score (MLS), summarizing the effects of replacing saturated fat with unsaturated fat on 45 lipid metabolite concentrations. In the EPIC-Potsdam cohort, a difference in the MLS, reflecting better dietary fat quality, was associated with a significant reduction in the incidence of cardiovascular disease (−32%; 95% confidence interval (95% CI): −21% to −42%) and type 2 diabetes (−26%; 95% CI: −15% to −35%). We built a closely correlated simplified score, reduced MLS (rMLS), and observed that beneficial rMLS changes, suggesting improved dietary fat quality over 10 years, were associated with lower diabetes risk (odds ratio per standard deviation of 0.76; 95% CI: 0.59 to 0.98) in the Nurses’ Health Study. Furthermore, in the PREDIMED trial, an olive oil-rich Mediterranean diet intervention primarily reduced diabetes incidence among participants with unfavorable preintervention rMLS levels, suggestive of disturbed lipid metabolism before intervention. Our findings indicate that the effects of dietary fat quality on the lipidome can contribute to a more precise understanding and possible prediction of the health outcomes of specific dietary fat modifications.
Main
Cardiovascular diseases (CVDs) account for approximately 20 million (34%) global deaths annually1. In addition, type 2 diabetes (T2D) substantially contributes to global noncommunicable disease burden and premature mortality, primarily through its vascular complications2. Therefore, reductions in cardiometabolic disease (that is, CVD and T2D) incidence yield substantial societal benefits3,4. The World Health Organization (WHO) recently issued dietary guidelines that advocate for reducing saturated fats while increasing unsaturated fats to prevent cardiometabolic diseases5, in line with evidence synthesis efforts and national guidelines that emphasize the importance of the type and quality of fats in the habitual diet6,7.
However, current controversies concerning the role of dietary fat in cardiometabolic health center on the potential metabolic benefits of a high-fat, low-carbohydrate diet (LCD) versus the merits of reducing saturated fat intake. For example, dairy products are high in saturated fatty acids (SFAs), and yet observational data indicate that their relation to cardiometabolic risk may be neutral or possibly beneficial, especially when compared to low levels of these foods or foods that are high in refined carbohydrates. The specific effect of replacing SFAs from animal sources with plant-based unsaturated fatty acids (UFAs) in the context of a moderately high-fat diet on cardiometabolic risk, including T2D and CVD, is still unclear. Given the complex, long-term nature of dietary impacts on health, definitive endpoint trials remain elusive.
Some populations appear to be especially vulnerable to the negative health impacts of specific diets5. The interplay of genetics, physiological traits and diet influences lipid metabolism and cardiometabolic disease development8,9,10,11,12. Therefore, a beneficial dietary fat composition may be especially critical in groups predisposed to dysregulated lipid metabolism.
Clinical lipid markers, like blood lipoproteins and triglycerides, commonly used as surrogates for cardiometabolic disease risk, are affected by dietary fat13,14,15. However, recent evidence challenges the traditional view that dietary fat quality influences cardiometabolic health primarily through these standard blood lipid profiles16. More complex effects of dietary fat quality on lipoprotein size and composition, as well as the direct involvement of specific lipid compounds in signal transduction, membrane fluidity and immune response, have been demonstrated16. Improved markers of metabolic adaptation to dietary fat quality also create opportunities to integrate data from shorter dietary randomized controlled trials (RCTs) and prospective cohort studies with long follow-ups and substantial numbers of incident disease cases.
Our recent studies have corroborated that comprehensive lipidomics profiles are susceptible to dietary fat modification and are strongly associated with cardiometabolic risk17,18,19. Other observational studies have generated multimetabolite signatures of dietary exposures, including a plant-based diet, dairy intake and a Mediterranean diet, and associated them with disease risk20,21,22,23,24,25,26. However, assessing diet effects on the metabolome in a well-conducted RCT reduces measurement error, rules out confounding by other lifestyle factors and relates metabolite signatures to a precisely defined diet substitution. Multistudy integration based on overlapping lipidomics profiling data can strengthen the evidence on the long-term health effects of dietary fat quality and offer potential applications in biomarker-driven precision nutrition27,28.
Here we test the hypothesis that alterations of the lipidome interlink the replacement of dietary SFAs with UFAs and cardiometabolic disease risk. We integrate lipid profiling data from dietary RCTs, which offer advantages in precise control of dietary exposures and protection against confounding, and large prospective cohort studies with substantial sample sizes, real-life dietary data and long duration of comprehensive phenotyping to examine the lipidome changes that relate dietary fat quality with cardiometabolic risk and examine potential precision nutrition applications.
Results
Study design
We generated a multilipid score (MLS) based on 45 of 111 analyzed lipid class-specific fatty acid concentrations using preintervention and postintervention lipidomics data in the Dietary Intervention and VAScular function (DIVAS) trial. DIVAS is a 16-week RCT comparing an SFA-rich diet to a diet high in plant-based UFAs29. Higher MLS levels reflect the effect of replacing dietary SFAs with plant-based UFAs on the lipidome (Fig. 1a). Using the population-based European Prospective Investigation into Cancer and Nutrition (EPIC)-Potsdam cohort study with the same lipidomics data, we linked the MLS that reflects better dietary fat quality to future cardiometabolic disease risks (Fig. 1b)30,31.
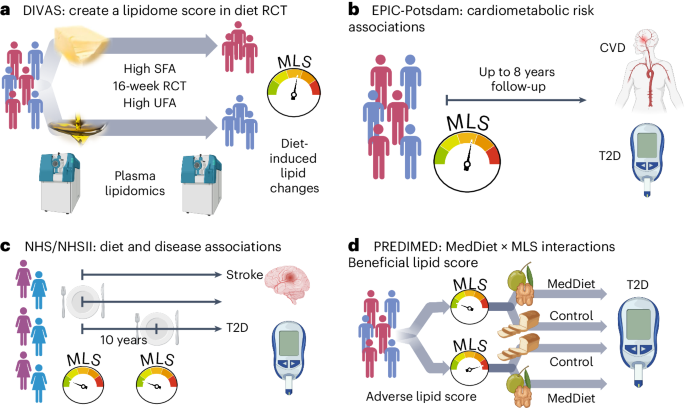
a, DIVAS trial. First, we use the DIVAS trial to generate an MLS of controlled unsaturated-for-saturated fat substitution. b, EPIC-Potsdam cohort. Second, we reconstruct the MLS and use it as a surrogate marker to estimate the expected cardiometabolic risk effects of the DIVAS intervention diet. c, NHS/NHSII cohorts. Third, we construct a highly correlated rMLS based on another lipidomics platform and link baseline levels and 10-year changes of this rMLS to cardiometabolic disease risk. d, PREDIMED trial. Fourth, we examine potential differences in the Mediterranean diet intervention effect on T2D risk across participants with different preintervention rMLS levels (effect modification). Figure created with BioRender.com.
We partially validated the DIVAS dietary SFA with UFA replacement effects on circulating lipid metabolites in the LIPOGAIN-2 trial, an 8-week overfeeding RCT with an SFA-enriched diet in the control group and a UFA-enriched diet intervention arm32. We also analyzed the Nurses’ Health Study (NHS) and NHSII cohorts and the Prevención con Dieta Mediterránea (PREDIMED) trial with Broad Institute lipidomics data, which provided relative abundances of a subset of the lipid metabolites included in the original MLS. A reduced MLS (rMLS) limited to lipids available on both platforms (42 lower-resolution lipid variables to reflect 15 class-specific fatty acid concentrations) was strongly correlated with the original MLS. In the NHS/NHSII cohorts, we replicated diet and disease associations and also related 10-year increases in rMLS levels (suggesting improved dietary fat quality) with subsequent T2D risk (Fig. 1c). In the PREDIMED trial, we examined if individuals with adverse preintervention rMLS levels, suggestive of unfavorable dietary fat quality before the intervention, benefit more from a Mediterranean diet intervention, which is high in plant-based UFAs, particularly from nuts and olive oil, and has been shown to lower CVD and T2D risk (Fig. 1d)33,34. The baseline characteristics of all studies are provided in Supplementary Tables 1–9.
An intervention-derived lipidomics score
We generated a summary score that reflects the influence of dietary fat quality on the lipidome in post hoc lipidomics analyses of the DIVAS dietary intervention trial. In the DIVAS trial, all diets were isoenergetic and provided 36% of the total energy from fats. Nonfat macronutrient intake and omega-3-poly-UFA (PUFA) intake were uniform across all diet groups. The control diet was high in SFAs (SFA-rich diet; 17% total energy from SFAs and 15% total energy from UFAs (11% mono-UFAs (MUFAs) and 4% omega-6-PUFAs); n = 65). The DIVAS trial had two intervention arms in which 8% of total energy from SFAs was replaced with 8% of total energy from UFAs, either only with MUFAs (SFA:MUFA:omega-6-PUFA content in percent total energy: 9:19:4) or with a mix of MUFAs and PUFAs (SFA:MUFA:omega-6-PUFA content in percent total energy: 9:13:10). Extensive sensitivity analyses showed that our analysis workflow yielded highly consistent results in the two intervention arms, and we therefore present comparisons between the control group (high SFA intake) and pooled intervention group (high UFA intake). In the pooled intervention group (UFA-rich diet; n = 130), dietary targets were 9% of total energy from SFAs and 23% of total energy from UFAs. Detailed dietary assessments yielded an estimated total energy intake contribution of 17.6% by SFAs and 14.5% by UFAs in the SFA-rich diet group and of 8.1% by SFAs and 24% by UFAs in the UFA-rich diet group (Fig. 2a and Extended Data Fig. 1)29,35.
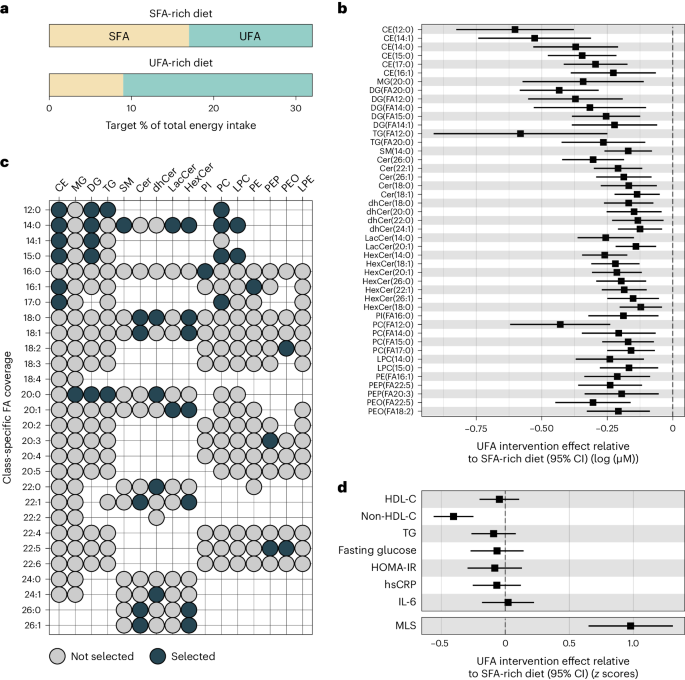
a, Target percentage of total energy intake from SFA and UFA sources per intervention arm. b, Effect of UFA-rich diet interventions relative to the SFA-rich diet on lipid concentrations (n = 113) modeled as postintervention concentration differences (95% CI) between SFA- and UFA-rich diets adjusting for baseline concentration, age, BMI and sex. Only statistically significantly changed lipids (FDR < 0.05) are shown. The center indicates the β-coefficient, and whiskers indicate 95% CIs. c, Selected lipids (FDR < 0.05) for the MLS calculation according to lipid class and fatty acid. d, Effect of UFA-rich diet interventions relative to the SFA-rich diet on MLS and established risk biomarkers (n = 113). MLS was calculated as weighted sum. Observed intervention effects served as weights. For comparison, MLS and risk biomarkers were variance standardized (unit = 1 s.d.). Data were modeled as postintervention score or concentration differences between SFA- and UFA-rich diets adjusting for baseline score level or concentration, age, BMI and sex. Results for established risk markers were originally published in Vafeiadou et al.29. The center indicates the β-coefficient, and the whiskers indicate the 95% CI. FA, fatty acid; TG, triglycerides; HOMA-IR, homeostatic model assessment for insulin resistance; IL-6, interleukin-6; hsCRP, high-sensitivity C-reactive protein.
A random sample of DIVAS trial participants (n = 113; Supplementary Table 2) underwent pre- and postintervention lipidomics profiling, measuring the absolute concentrations of 987 molecular lipid species. We summarized the absolute levels of up to 28 specific fatty acids (12–26 carbon atoms, 0–6 unsaturations) in 16 lipid classes (7 phospholipid (sub)classes, 5 sphingolipid classes, 3 neutral glycerolipid classes and cholesterol esters), generating 111 lipid class-specific fatty acid concentrations. We then compared lipidomics responses to the intervention diet versus to the control diet. After multiple testing correction (false discovery rate (FDR) < 0.05), the replacement of SFAs with UFAs in the diet intervention group significantly reduced the circulating concentrations of 45 class-specific fatty acids (Fig. 2b).
The UFA-rich diet primarily reduced lipid metabolites with medium- or long-chain fatty acid residuals that contain no (for example, C12:0, C14:0, C18:0 and C20:0) or few (for example, C14:1 and C16:1) unsaturations. In descending frequency, the affected lipid metabolites belonged to the classes of ceramides (n = 18; including ceramides, dihydroceramides, lactosylceramides and hexosylceramides), cholesterol esters (n = 6), phosphatidylcholines (n = 6), diglycerides (n = 5), phosphatidylethanolamines (n = 5; including alkyl- and plasmalogen-phosphatidylethanolamines), triglycerides (n = 2), lysophosphatidylcholines (n = 2), monoglycerides (n = 1), sphingomyelins (n = 1) and phosphatidylinositols (n = 1; Fig. 2c).
We summarized the statistically significant effects of the UFA-rich diet intervention on lipid metabolites in a weighted MLS. The DIVAS diet effect estimates were defined as score weights. Detailed information to reconstruct the MLS based on absolute lipid concentrations is provided in Supplementary Tables 10 and 11. As such, a higher MLS reflects a higher UFA intake. This MLS increased substantially in the UFA-rich intervention diet group compared to in the SFA-rich diet control group (+0.98 s.d.; Fig. 2d). For comparison, we show the effects of the DIVAS diet interventions on blood lipids (high-density lipoprotein cholesterol (HDL-C), non-HDL-C and triglycerides), glucose markers (fasting glucose and homeostatic model assessment for insulin resistance) and inflammation markers (high-sensitivity C-reactive protein (hsCRP) and interleukin-6). Among these clinical cardiometabolic risk markers, the DIVAS intervention diet only affected non-HDL-C levels (−0.4 s.d., FDR < 0.05; Fig. 2d)29.
Lipidomics score correlations with foods and biomarkers
We constructed the DIVAS-derived MLS in the EPIC-Potsdam cohort using harmonized lipidomics data. This was done within a CVD and T2D case–cohort design. This study included a random subcohort of 1,262 individuals who were representative of the entire cohort without prevalent cardiometabolic conditions. Additionally, we oversampled participants who developed CVD (n = 551) or T2D (n = 775) during the follow-up period (Supplementary Table 3). The MLS distribution in the subcohort was approximately normal, with similar variance across sexes (Fig. 3a,b).
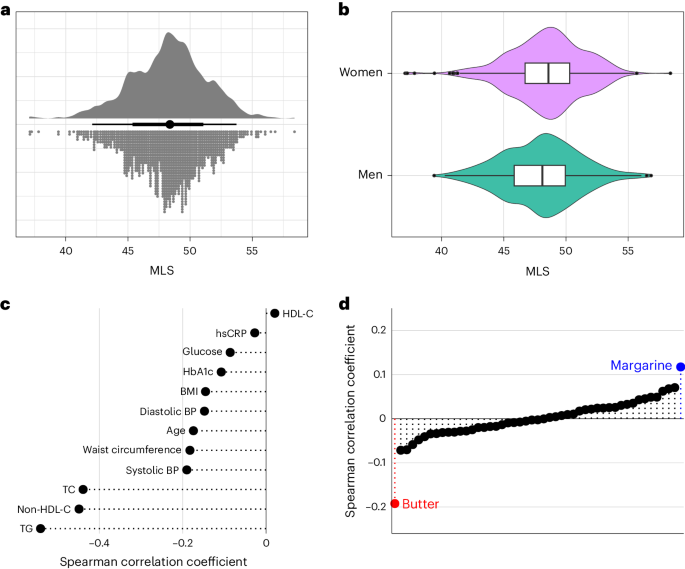
a, Univariate distribution of the MLS (n = 1,148). b, Distribution of the MLS in men (n = 438) and women (n = 710). The center line indicates the median, hinges indicate the first and third quartiles, and whiskers indicate the median ± 1.5 × interquartile range. c, Spearman correlation of the MLS with age, anthropometry, blood pressure and standard clinical biomarkers. d, Spearman correlation of the MLS with self-reported habitual intake of different food groups. Highlighted are the strongest positively (margarine) and negatively (butter) correlated foods. BP, blood pressure; TC, total cholesterol.
The MLS weakly inversely correlated with age, body mass index (BMI), waist circumference and blood pressure and moderately inversely correlated with triglycerides, non-HDL-C and total cholesterol (Fig. 3c). Among food groups, the MLS showed the most pronounced positive correlation with margarine and the most pronounced inverse correlation with butter (Fig. 3d). Butter fat contains around 65% SFAs and 28% MUFAs and small amounts of PUFAs and naturally occurring trans-fat. Typical margarine contains 80% total fat, of which around 20% are SFAs, 50% are MUFAs and 30% are PUFAs36. A comprehensive list of MLS correlations with food group intake in the EPIC-Potsdam cohort is available in Supplementary Table 12. These analyses conducted in a free-living study population show that the MLS correlates in the expected directions with the primary sources of plant-based UFAs and dairy SFAs in participants’ diets.
Lipidomics score associations with CVD and T2D
In the EPIC-Potsdam cohort, we associated the MLS with cardiometabolic disease risk, standardizing the MLS to the postintervention contrast between the control and intervention groups in the DIVAS trial. Therefore, cardiometabolic risk estimates in the EPIC-Potsdam cohort reflect expected effects of the DIVAS trial diet intervention-induced difference in the MLS. The Cox proportional hazards models were adjusted for age, sex, waist circumference, height, leisure-time physical activity, highest achieved education level, fasting status at blood draw, total energy intake, blood pressure (systolic and diastolic), smoking status, alcohol intake, use of antihypertensive medication, lipid-lowering medication and acetylsalicylic acid medication.
In the EPIC-Potsdam cohort, the DIVAS diet-induced MLS difference was associated with 32% (95% confidence interval (95% CI): 21% to 42%) lower CVD (composite endpoint of primary incidence of myocardial infarction (MI) and stroke) and 26% (95% CI: 15% to 35%) lower T2D incidence. Additional adjustment for triglycerides, total cholesterol, HDL-C, non-HDL-C, hemoglobin A1c (HbA1c) or hsCRP did not substantially alter the MLS–CVD association. The association of the MLS with T2D risk was rendered statistically nonsignificant after adjustment for triglycerides but was only marginally affected by adjustment for the other standard metabolic risk biomarkers (Fig. 4a).
No comments:
Post a Comment