Your doctor should be using this test on you because of your risk of Parkinsons post stroke.
Parkinson’s Disease May Have Link to Stroke March 2017
Your doctor is then required to have EXACT PROTOCOLS that prevent Parkinsons. Your doctor has no excuses for not having EXACT PARKINSONS PREVENTION PROTOCOLS! 7 years is plenty of time for competent doctors to come up with those protocols, especially since thousands of doctors need those protocols! But since there is NO leadership in stroke, NOTHING ever gets done!
Plasma proteomics identify biomarkers predicting Parkinson’s disease up to 7 years before symptom onset
Nature Communications volume 15, Article number: 4759 (2024)
Abstract
Parkinson’s disease is increasingly prevalent. It progresses from the pre-motor stage (characterised by non-motor symptoms like REM sleep behaviour disorder), to the disabling motor stage. We need objective biomarkers for early/pre-motor disease stages to be able to intervene and slow the underlying neurodegenerative process. Here, we validate a targeted multiplexed mass spectrometry assay for blood samples from recently diagnosed motor Parkinson’s patients (n = 99), pre-motor individuals with isolated REM sleep behaviour disorder (two cohorts: n = 18 and n = 54 longitudinally), and healthy controls (n = 36). Our machine-learning model accurately identifies all Parkinson patients and classifies 79% of the pre-motor individuals up to 7 years before motor onset by analysing the expression of eight proteins—Granulin precursor, Mannan-binding-lectin-serine-peptidase-2, Endoplasmatic-reticulum-chaperone-BiP, Prostaglaindin-H2-D-isomaerase, Interceullular-adhesion-molecule-1, Complement C3, Dickkopf-WNT-signalling pathway-inhibitor-3, and Plasma-protease-C1-inhibitor. Many of these biomarkers correlate with symptom severity. This specific blood panel indicates molecular events in early stages and could help identify at-risk participants for clinical trials aimed at slowing/preventing motor Parkinson’s disease.
Introduction
Parkinson’s disease (PD) is a complex and increasingly prevalent neurodegenerative disease of the central nervous system (CNS). It is clinically characterised by progressive motor and non-motor symptoms that are caused by α-synuclein aggregation predominantly in dopaminergic cells, which leads to Lewy body (LB) formation1. The failure of neuroprotective strategies in preventing disease progression is due, in part, to the clinical heterogeneity of the disease—it has several phenotypes—and to the lack of objective biomarker readouts2. To facilitate the approval of neuroprotective strategies, governing agencies and pharmaceutical companies need regulatory pathways that use objectively measurable markers—potential therapeutical targets as well as state and rate biomarkers—directly associated with PD pathophysiology and clinical phenotypes3.
The recently emerged α-synuclein seed amplification assays (SAA) can identify α-synuclein pathology in vivo and support stratification purposes but still rely on cerebrospinal fluid (CSF) obtained through relatively invasive lumbar punctures4. Therefore, this test remains specialised and not readily suitable for large-scale clinical use. As peripheral fluid biomarkers are less invasive and easier to obtain, they could be used in repeated and long-term monitoring, which is necessary for population-based screenings for upcoming neuroprotective trials. While the only emerged serum biomarker in the last years, axonal marker neurofilament light chain (NfL), increases longitudinally and correlates with motor and cognitive PD progression5, it is non-specific to the disease process.
Growing data support evidence of PD pathology in the peripheral system, which increases the likelihood of finding a source of matrices for less invasive biomarkers. We know α-synuclein aggregation induces neurodegeneration, which is propagated throughout the CNS. Evidence indicates that additional inflammatory events are an early and potentially initial step in a pathophysiological cascade leading to downstream α-synuclein aggregation that activates the immune system6. Inflammatory risk factors in circulating blood (i.e. C-reactive-protein and Interleukin-6 and α-synuclein-specific T-cells) are associated with motor deterioration and cognitive decline in PD7,8. These inflammatory blood markers can even be identified in plasma/serum samples of individuals with isolated REM sleep behaviour disorder (iRBD), the early stage of a neuronal synuclein disease (NSD), and the most specific predictor for PD and dementia with Lewy bodies (DLB)6. NSD was recently proposed as a biologically defined term, for a spectrum of clinical syndromes, including iRBD, PD and DLB, that follow an integrated clinical staging system of progressing neuronal α-synuclein pathology (NSD-ISS)9.
In this study, we used mass spectrometry-based proteomic phenotyping to identify a panel of blood biomarkers in early PD. In the initial discovery stage, we analysed samples from a well-characterised cohort of de novo PD patients and healthy controls (HC) who had been subjected to rigorous collection protocols10. Using unbiased state-of-the-art mass spectrometry, we identified putatively involved proteins, suggesting an early inflammatory profile in plasma. We thereafter moved on to the validation phase by creating a high-throughput and targeted proteomic assay that was applied to samples from an independent replication cohort, consisting of de novo PD, HC and iRBD patients. Finally, after refining the targeted proteomic panel to include a multiplex of only the biomarkers which were reliably measured, an independent analysis was performed on a larger and independent cohort of longitudinal, high-risk subjects who had been confirmed as iRBD by state-of-the-art video-recorded polysomnography (vPSG), including follow-up sampling of up to 7 years.
In summary, using a panel of eight blood biomarkers identified in a machine-learning approach, we were able to differentiate between PD and HC with a specificity of 100%, and to identify 79% of the iRBD subjects, up to 7 years before the development of either DLB or motor PD (NSD stage 3). Our identified panel of biomarkers significantly advances NSD research by providing potential screening and detection markers for use in the earliest stages of NSD for subject identification/stratification for the upcoming prevention trials.
Results
Proteomic discovery phase 0
We performed a bottom-up proteomics analysis of plasma, which had been depleted of the major blood proteins, using two-dimensional in-line liquid chromatography fractionation into ten fractions and label-free mass spectrometric analysis by QTOF MSE. The discovery cohort consisted of ten randomly selected drug-naïve patients with PD and ten matched HC from the de novo Parkinson’s disease (DeNoPa10) cohort (details can be found in Supplementary Table 1). This analysis identified 1238 proteins when restricting identification to originate from at least one peptide per protein and at least two fragments per peptide. After excluding proteins with less than two unique peptides or with an identification score below a set threshold (see method section below), 895 distinct proteins remained. Of these proteins, 47 were differentially expressed between the de novo PD and control groups on a nominal significance level of 95%. Pathway analysis suggested enrichment in several inflammatory pathways. Workflow and Results are shown in Fig. 1, and 2 Supplementary Figs. 1, 2.
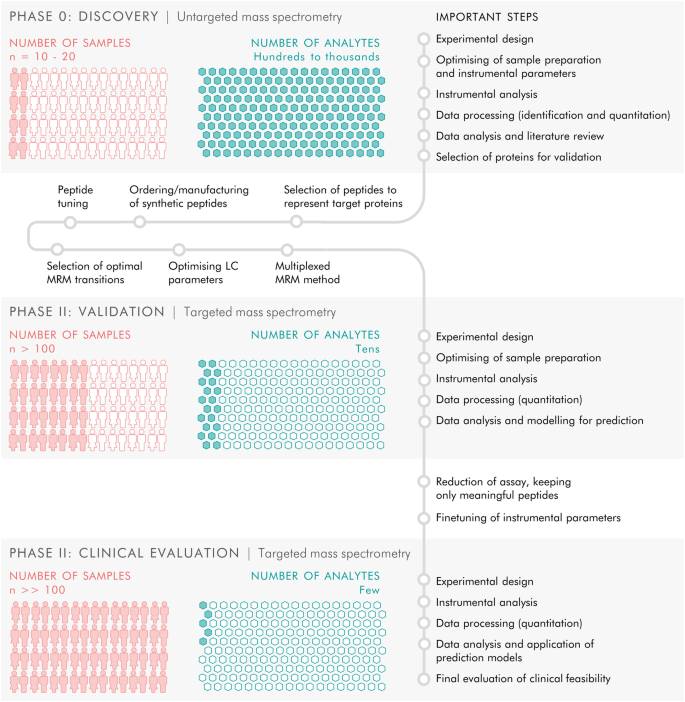
The study included three phases. Phase 0 consisted of discovery proteomics by untargeted mass spectrometry to identify putative biomarkers, followed by phase I in which targets from the discovery phase were transferred to a targeted, mass spectrometric MRM method and applied to a new and larger cohort of samples, and finally phase II in which the targeted MRM method was refined and a larger number of samples were analysed to evaluate the clinical feasibility of the targeted protein panel.
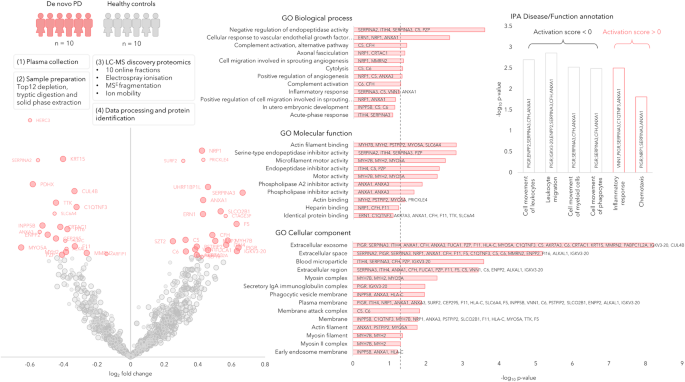
The circle radii in the Volcano plot represent the identification certainty, where large radii represent proteins identified by at least two unique peptides and an identification score >15, smaller radii are given for proteins identified by two or more unique peptides or a confidence score >15. The horizontal axis shows log2 of the average fold-change and the vertical axis shows −log10 of the p values. The significantly different proteins are annotated by gene name and coloured in pink, while the non-significant proteins are coloured in grey. GO annotations for the significant proteins are shown, the dashed line represents p = 0.05. Disease and function annotations from IPA are shown, divided into annotations with a positive or negative activation score. Source data are provided as a Source Data file.
More at link.
No comments:
Post a Comment