Changing stroke rehab and research worldwide now.Time is Brain! trillions and trillions of neurons that DIE each day because there are NO effective hyperacute therapies besides tPA(only 12% effective). I have 523 posts on hyperacute therapy, enough for researchers to spend decades proving them out. These are my personal ideas and blog on stroke rehabilitation and stroke research. Do not attempt any of these without checking with your medical provider. Unless you join me in agitating, when you need these therapies they won't be there.

What this blog is for:

My blog is not to help survivors recover, it is to have the 10 million yearly stroke survivors light fires underneath their doctors, stroke hospitals and stroke researchers to get stroke solved. 100% recovery. The stroke medical world is completely failing at that goal, they don't even have it as a goal. Shortly after getting out of the hospital and getting NO information on the process or protocols of stroke rehabilitation and recovery I started searching on the internet and found that no other survivor received useful information. This is an attempt to cover all stroke rehabilitation information that should be readily available to survivors so they can talk with informed knowledge to their medical staff. It lays out what needs to be done to get stroke survivors closer to 100% recovery. It's quite disgusting that this information is not available from every stroke association and doctors group.

Monday, February 23, 2015

BrainBrowser: distributed, web-based neurological data visualization

Ask your doctor if this is enough to get 3d images of damaged parts of your brain and then correlate stroke protocols that fix such damage. This would be the holy grail of stroke rehab. We just need our doctors to implement this. It is so goddammed simple even I can see the possibilities.
http://journal.frontiersin.org/article/10.3389/fninf.2014.00089/full?
Tarek Sherif, Nicolas Kassis, Marc-Étienne Rousseau, Reza Adalat and Alan C. Evans*
  • McGill Centre for Integrative Neuroscience, McConnell Brain Imaging Centre, Montreal Neurological Institute, McGill University, Montreal, QC, Canada
Recent years have seen massive, distributed datasets become the norm in neuroimaging research, and the methodologies used to analyze them have, in response, become more collaborative and exploratory. Tools and infrastructure are continuously being developed and deployed to facilitate research in this context: grid computation platforms to process the data, distributed data stores to house and share them, high-speed networks to move them around and collaborative, often web-based, platforms to provide access to and sometimes manage the entire system. BrainBrowser is a lightweight, high-performance JavaScript visualization library built to provide easy-to-use, powerful, on-demand visualization of remote datasets in this new research environment. BrainBrowser leverages modern web technologies, such as WebGL, HTML5 and Web Workers, to visualize 3D surface and volumetric neuroimaging data in any modern web browser without requiring any browser plugins. It is thus trivial to integrate BrainBrowser into any web-based platform. BrainBrowser is simple enough to produce a basic web-based visualization in a few lines of code, while at the same time being robust enough to create full-featured visualization applications. BrainBrowser can dynamically load the data required for a given visualization, so no network bandwidth needs to be waisted on data that will not be used. BrainBrowser's integration into the standardized web platform also allows users to consider using 3D data visualization in novel ways, such as for data distribution, data sharing and dynamic online publications. BrainBrowser is already being used in two major online platforms, CBRAIN and LORIS, and has been used to make the 1TB MACACC dataset openly accessible.

1. Introduction

BrainBrowser is an open source JavaScript library exposing a set of web-based 3D visualization tools primarily targeting neuroimaging. Using open web technologies, such as WebGL and HTML5, it allows for real-time manipulation and analysis of 3D imaging data through any modern web browser. BrainBrowser includes two major components. The BrainBrowser Surface Viewer (Figure 1) is a WebGL-based 3D viewer capable of displaying 3D surfaces in real time and mapping various sorts of data to them. The BrainBrowser Volume Viewer (Figure 2) is an HTML5 Canvas-based viewer allowing slice-by-slice traversal of 3D or 4D MINC volumetric data (Vincent et al., 2004).
FIGURE 1
www.frontiersin.org 
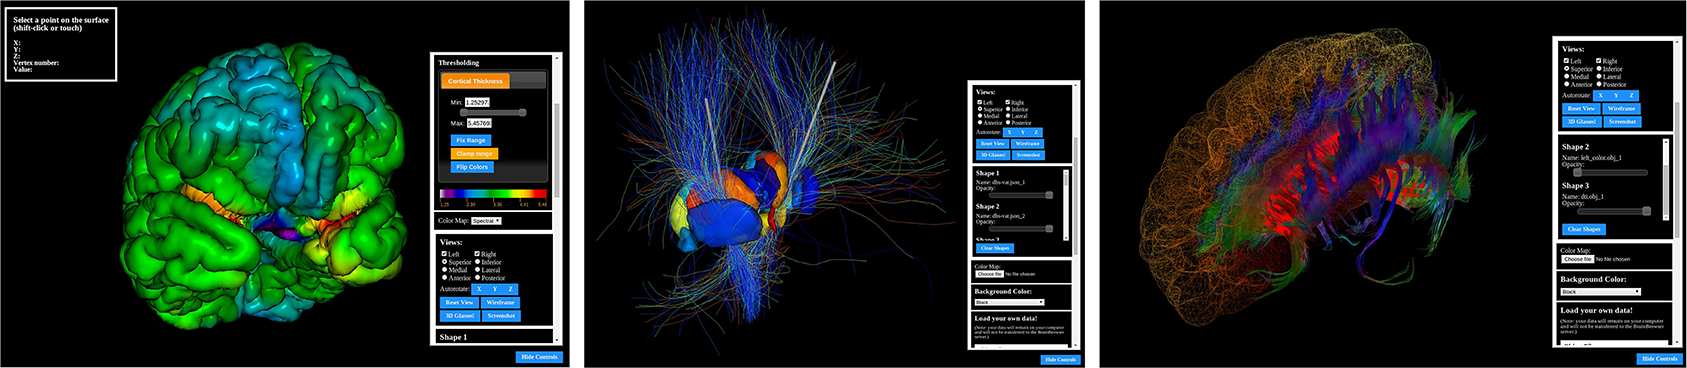
Figure 1. The BrainBrowser Surface Viewer.
FIGURE 2
www.frontiersin.org 
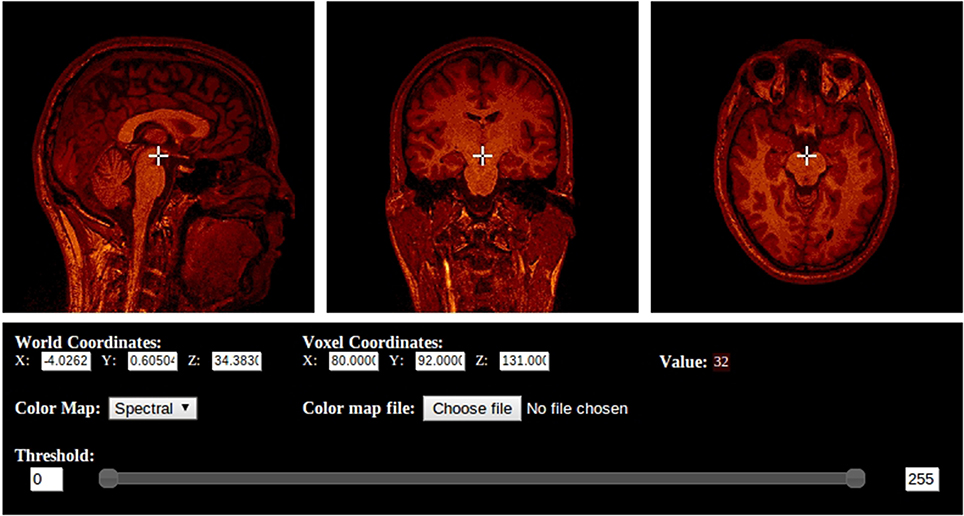
Figure 2. The BrainBrowser Volume Viewer.
In recent years, neuroimaging research has seen itself inundated by large, distributed datasets that have necessitated a shift in how scientists approach their research: guiding hypotheses are often articulated after analyzing the mass of available data (Margulies et al., 2013), and data sharing has become a necessity for scientific discovery (Jomier et al., 2011). Several large-scale, distributed, collaborative platforms have been developed to facilitate this new approach, and they tend to integrate poorly with traditional visualization tools requiring a local installation and local data. These tools and their dependencies would have to be installed locally, and data would generally have to be exported from the platform in order to be visualized in the local environment. Web-based visualization tools, on the other hand, present significant benefits in the context of distributed research platforms:

No comments:

Post a Comment