I got absolutely nothing out of this that would help survivors recover.
Redundancy Among Parameters Describing the Input-Output Relation of Motor Evoked Potentials in Healthy Subjects and Stroke Patients
 Claire Kemlin1,
  Eric Moulton1, Sara Leder2,
  Marion Houot3, Sabine Meunier1,
  Charlotte Rosso1,2† and
  Jean-Charles Lamy1*†
- 1Institut du Cerveau et de la Moelle épinière, ICM, Inserm U 1127, CNRS UMR 7225, Sorbonne Université, Paris, France
- 2APHP, Urgences Cérébro-Vasculaires, Hôpital de la Pitié Salpêtrière, Paris, France
- 3AP-HP, Department of Neurology, Hôpital de la Pitié-Salpêtrière, Centre of excellence of neurodegenerative disease (CoEN), Institute of Memory and Alzheimer's Disease (IM2A), ICM, CIC Neurosciences, Paris, France
Background: Transcranial magnetic
stimulation (TMS) is widely used to probe corticospinal excitability
through Motor Evoked Potential (MEP) amplitude measurements. The
input-output (I/O) curve is a sigmoid-shaped relation between the MEP
amplitude at incremented TMS intensities. The aim of this study was to
examine the relationships between seven parameters derived from the
sigmoid function.
Methods: Principal Component Analysis
and Spearman's rank correlation matrices were used to determine if the
seven I/O curve parameters capture similar or, conversely, different
aspects of the corticospinal excitability in 24 healthy subjects and 40
stroke survivors with a hand motor impairment.
Results: Maximum amplitude (MEPmax),
peak slope, area under the I/O curve (AUC), and MEP amplitude recorded
at 140% of the resting motor threshold showed strong linear
relationships with each other (ρ > 0.72, p < 0.001).
Results were found to be similar in healthy subjects and in both
hemispheres of stroke patients. Our results did not support an added
benefit of sampling entire I/O curves in both healthy subjects and
stroke patients, with the exception of S50, the stimulus intensity needed to obtain half of MEPmax amplitude.
Conclusions: This demonstrates that MEP
elicited at a single stimulus intensity allows to capture the same
characteristics of the corticospinal excitability as measured by the
AUC, MEPmax and the peak slope, which may be of interest in
both clinical and research settings. However, it is still necessary to
plot I/O curves if an effect or a difference is expected at S50.
Introduction
Transcranial magnetic stimulation (TMS) is widely used
to probe corticospinal excitability in both healthy subjects and in a
broad range of neuropsychiatric conditions. A common approach from basic
research to pivotal clinical trials is to compare recruitment curves of
TMS-induced motor evoked potentials (MEPs) between groups of subjects
or before and after different types of interventions aimed at promoting
brain plasticity (i.e., pharmacotherapy or non-invasive brain
stimulation).
, where MEP(s) is the MEP amplitude at the stimulation intensity s, MEPmax is the maximum MEP amplitude, S50 is the stimulus intensity needed to obtain 50% of MEPmax amplitude, and m is the slope parameter of the sigmoid function, i.e., the global slope of the function (Figure 1).
Three additional parameters can be derived from the I/O curve: (1) the
peak slope (PS), i.e., the instantaneous slope of the ascending limb of
the curve at S50, which reflects the recruitment gain of motoneurons and is given by the formula: PS = m x MEPmax/4, (2) the x-intercept (Xint) of the tangent at S50, and (3) the area under the I/O curve (AUC) usually calculated using the trapezoidal area method (5).
FIGURE 1
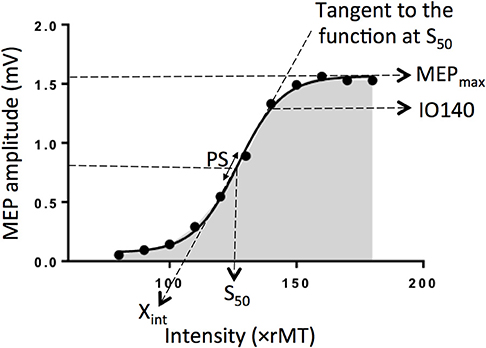 Figure 1.
Electrophysiological parameters extracted from an example of an input
output curve (I/O curve) fitted by a sigmoid function. Are shown the
following variables: Xint: X intercept, IO140: Motor Evoked
Potential amplitude recorded at 140% rMT, PS, peak slope; AUC, area
under the I/O curve in gray; S50, stimulus intensity needed to obtain 50% of the maximum response; MEPmax, maximum value of the sigmoid function.
Figure 1.
Electrophysiological parameters extracted from an example of an input
output curve (I/O curve) fitted by a sigmoid function. Are shown the
following variables: Xint: X intercept, IO140: Motor Evoked
Potential amplitude recorded at 140% rMT, PS, peak slope; AUC, area
under the I/O curve in gray; S50, stimulus intensity needed to obtain 50% of the maximum response; MEPmax, maximum value of the sigmoid function.
To date, the inter-dependency
between all these parameters are not fully understood. Indeed, although
the PS depends on both m parameter and MEPmax, it does not mean these three parameters are correlated together. Same for Xint, which depends on m parameter and S50.
The question arises whether these variables capture similar or,
conversely, different aspects of the corticospinal excitability and if
so, how each of them relates to one other. To clarify the
interdependency between these parameters, we estimated I/O curves from
the dominant hemisphere of healthy volunteers and performed Principal
Component Analyses (PCA) in addition to correlation matrices to
summarize the most important linear relationships between variables. PCA
is a tool capable of summarizing the most important linear
relationships between variables and computing synthetic variables from
the original variables named principal components (PCs). PCA provides a
visual and geometric representation of the correlation matrix (6, 7).
In a second step, to test whether our results could be extrapolated to
patients suffering from neurological conditions, we performed the same
analyses on data collected in both the affected and unaffected
hemispheres of stroke patients given that this population represents the
most frequent brain damaged disease worldwide. Indeed, the sigmoid
function has been previously shown to be a reliable method to plot IO
curve in stroke patients (4).
More at link.
No comments:
Post a Comment