I may be missing something but the results as listed have ABSOLUTELY NOTHING THAT WILL HELP RECOVERY. Please read at the very bottom the Discussion and you will see what I mean; useless.
Effects of Changes in Ankle Joint Angle on the Relation Between Plantarflexion Torque and EMG Magnitude in Major Plantar Flexors of Male Chronic Stroke Survivors
 Jongsang Son1,2* and
  William Zev Rymer1,2
- 1Shirley Ryan AbilityLab (formerly the Rehabilitation Institute of Chicago), Chicago, IL, United States
- 2Department of Physical Medicine and Rehabilitation, Northwestern University, Chicago, IL, United States
Introduction
Weakness of voluntary muscle contraction is a dominant
clinical feature after hemispheric stroke, and the severity of such
weakness is correlated with a stroke survivor's independence in
performing many functional tasks (1). This reduction in voluntary muscle strength is typically the most obvious motor deficit (2),
and many clinical phenomena observed in chronic stroke survivors could
be attributed to a loss of strength rather than to a loss of control (3).
In addition to muscle weakness, muscular contractions in
stroke-impaired muscles often appear less efficient than in
contralateral muscles or in analogous muscles of intact subjects,
potentially contributing to impaired voluntary force generation. To
illustrate this assertion further (4),
reported that in approximately half of the tested human stroke
survivors, during sustained isometric voluntary contractions at
different intensities, the slope of the biceps brachii (BB)
electromyogram (EMG)-force relations was significantly greater on the
paretic side than on the non-paretic side. A similar finding was also
observed in paretic first dorsal interosseous (FDI) muscles of chronic
stroke survivors (5),
implying that paretic muscles may require the recruitment of more motor
units to achieve a given muscle force, and thus, display inefficient
muscular contractions.
It is evident then, that altered motor unit behavior may
result in inefficient muscular contractions. For example, abnormally
low mean motor unit firing rates were observed in paretic tibialis
anterior (TA) muscles (6, 7) and in paretic BB muscles (8).
There is also evidence for additional altered motor unit behavior,
including compressed motor unit recruitment threshold ranges during
isometric contractions of the paretic BB muscles (8), impairments in firing rate modulation in paretic BB muscles (9), disorganization in the rank order of recruitment in paretic FDI muscles (10), and a compressed range of motor unit firing rates in paretic FDI muscles (11).
Moreover, a recent simulation study revealed that the recruitment
compression and a compressed “onion-skin” firing pattern can potentially
also contribute to voluntary muscle weakness (12).
In addition, the slope of EMG-force relation was reported to increase
in concert with compressed motor unit recruitment threshold ranges and
reductions of mean motor unit firing rates (13).
Although these earlier studies support the idea that altered neural
factors can contribute, these neural factors may not be enough to
explain a complicated EMG-force relation, because the EMG-force relation
is an outcome of both neural and muscular factors.
In particular, muscular changes may also contribute to voluntary muscle weakness (14–17).
Although our understanding of muscular changes after hemispheric stroke
is still limited, it is relevant to note that decreased muscle
thickness is often associated with reduced force output at a given level
of muscle activation. In addition, the maximum isometric muscle force
varies depending on the muscle length (18),
and this force-length relation may also be substantially altered after
stroke. For example, the width of the active force-length curve seems
narrower in the paretic medial gastrocnemius (MG) muscles (19)
than in the equivalent contralateral muscles. Such altered contractile
properties may lead to modified torque-angle curves, showing a
significant reduction in the magnitude of the torque at joint angles
where muscle length is short (3, 20–22),
potentially resulting in a higher slope of the EMG-torque relation at
such a short length. This outcome is likely because the effective torque
at shorter lengths is smaller at a given EMG. Furthermore, material
properties of muscle tissues seem to contribute to muscle mechanics,
revealing that a stiffer material surrounding contractile elements of
muscle tissues can reduce fascicle strain as well as muscle force (23–26).
Based on these observations, it is likely that muscular factors can
also play a part in the abnormal EMG-torque relation observed in chronic
stroke survivors.
In light of these uncertainties, the purpose of this
study is to characterize the EMG-torque relations of calf muscles at
different ankle joint angles on both paretic and non-paretic sides in
chronic stroke survivors, and thus, to understand how the slope of such
relations (i.e., muscle efficiency-related parameter) is altered by
changing joint angles. We hypothesize that the slope becomes greater as
calf muscle lengths shorten because the operating range of calf muscles
is usually located in the ascending limb of active force-length curve,
so that the maximum force gradually decreases with shortening muscle
lengths (27–29).
We also hypothesize that as the muscle length becomes shorter, a
greater increase in the slope is more likely to be observed on the
paretic side than on the non-paretic side. This is because the width of
the active force-length curve may be narrower on the paretic side (19)
and thus, the relative reduction in the magnitude of peak forces on the
paretic side becomes greater at comparable muscle lengths.
As a secondary goal, we also seek to characterize the
relation between the maximum joint torque at each joint angle and the
EMG-torque slope at this joint angle. Our hypothesis here is that the
greater the slope, the smaller the maximum joint torque. This is because
the slope is a measure of muscular contraction efficiency.
In order to better understand the potential impact of
intrinsic muscular changes of muscular contraction efficiency after, we
propose to assess associations between the relative slope-related
parameter and the relative shear wave speed (SWS) and between the
relative slope-related parameter and the relative muscle thickness. SWS
is a non-invasive measure of tissue stiffness (30),
and it has been shown that shear waves travel faster in paretic MG
muscles than in non-paretic muscles of chronic stroke survivors (31, 32).
More at link.
But here are the results.
Results
The total number of subjects examined was 9 for MG and LG
analyses and 8 for SOL and ALL analyses. This is because we excluded
the subject when reporting SOL and ALL as the EMG recording from the SOL
muscle was not successful in one of our subjects.
Passive Range of Motion at Ankle Joint
The passive range of motion at ankle joint on the paretic
side (32.0°; IQR = 30.0–40.0) was significantly smaller by ~25% than on
the non-paretic side (42.0°, IQR = 37.3–45.0) (p = 0.031, dz
= 0.992). Although the median maximum PF (30.0°, IQR = 30.0–35.3) and
DF (−3.0°, IQR = −6.3–1.5) on the paretic side was smaller than on the
non-paretic side (PF: 34.0°, IQR = 30.0–37.8; DF: −5.0°, IQR = −11.3 to
−3.8), there was no significant side-to-side difference in the maximum
PF (p = 0.156, dz = 0.548) or in the maximum DF (p = 0.063, dz = 0.816).
Effect of Joint Angles on Maximum RMS EMG and Joint Torque
When compared to the non-paretic side, the maximum RMS EMG on the paretic side was significantly smaller in the MG (p = 0.003,
= 0.683) and LG (p = 0.003, = 0.685) muscles, but not in the TA (p = 0.122, = 0.272) and SOL (p = 0.096, = 0.307) muscles (Figure 3). However, the maximum RMS EMG was not a function of the ankle joint angles in all the muscles (TA: p = 0.104, = 0.734; MG: p = 0.093, = 0.747; LG: p = 0.366, = 0.521; SOL: p = 0.172, = 0.666). Moreover, there was no significant interaction between the side and the ankle joint angle in all the muscles (TA: p = 0.387, = 0.507; MG: p = 0.271, = 0.586; LG: p = 0.247, = 0.604; SOL: p = 0.427,
= 0.481). Note that the magnitude of TA RMS EMG was considerably
smaller than the other muscles, which indicates that the potential
effects of muscle co-contraction would likely be negligible.
The overall magnitude of the maximum joint torque on the paretic side was significantly smaller than on the contralateral side (p = 0.001, = 0.776; Figure 4), showing significant differences at all the angles (p < 0.01). Furthermore, the maximum joint torque increased as the ankle joint became dorsiflexed (p = 0.029,
= 0.845), showing that the maximum joint torque at the dorsiflexed
angles beyond the neutral angles was significantly greater than at the
plantarflexed positions (p < 0.05). There was a significant interaction between the side and the ankle joint angle (p = 0.049,
= 0.808).
FIGURE 4
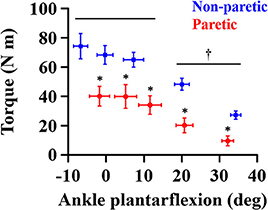 Figure 4. Maximum joint torque at each ankle angle. Negative angles indicate dorsiflexion. *a significant difference in pairwise comparisons between the side (p < 0.01). †a significant difference in torque between dorsiflexed angles and plantarflexed angles (p < 0.05).
EMG-Torque Relations
As the ankle angle became more plantarflexed, the slope of the EMG-torque relations increased progressively (Figure 5). Table 1 summarizes the coefficient a and b for each calf muscle and ALL. For the MG muscle, the coefficient a on the paretic side was significantly greater than on the non-paretic side (p = 0.008, dz
= 0.549), indicating the greater increase in the slope as the ankle
joint becomes plantarflexed. There was no significant difference in the
coefficient b between sides (p = 0.359, dz = 0.089), indicating that the slope was not significantly different at the maximum DF angles.
FIGURE 5
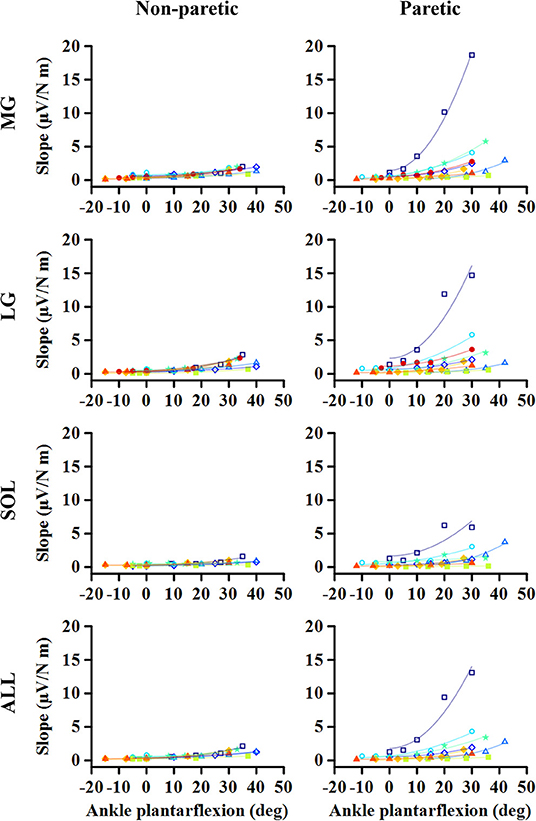 Figure 5. Changes in EMG-torque slope as a function
of ankle angle. Note that the effects of changing the ankle angle on the
EMG-torque slope are more significant on the paretic side than on the
non-paretic side. Markers and lines indicate raw data and fitted results
from each individual (in different colors), respectively.
Figure 5. Changes in EMG-torque slope as a function
of ankle angle. Note that the effects of changing the ankle angle on the
EMG-torque slope are more significant on the paretic side than on the
non-paretic side. Markers and lines indicate raw data and fitted results
from each individual (in different colors), respectively.
TABLE 1
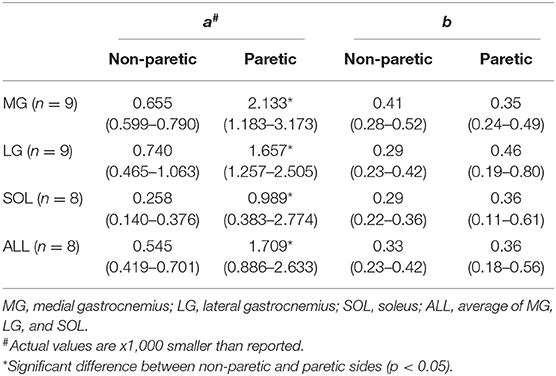 Table 1. The coefficient a and b values for the slope of EMG-torque relations (S) and ankle plantarflexion angle (A). S = aA2 + b.
Similar results were found in the other muscles. The coefficient a on the paretic side was significantly greater than on the non-paretic side (LG: p = 0.004, dz = 0.548; SOL: p = 0.008, dz = 0.802; ALL: p = 0.008, dz = 0.601), whereas there was no significant difference in the coefficient b between sides (LG: p = 0.250, dz = 0.501; SOL: p = 0.547, dz = 0.357; ALL: p = 0.945, dz = 0.315).
Torque-Slope Relations
For all the cases, the maximum voluntary isometric
plantarflexion torque was smaller as the slope of the EMG-torque
relations was greater (Figure 6). Table 2 summarizes the coefficient c for each calf muscle and ALL. The coefficient c was significantly smaller on the paretic side than on the non-paretic side (MG: p = 0.020, dz = 1.190; SOL: p = 0.016, dz = 1.326; ALL: p = 0.016, dz = 1.321) except for LG (p = 0.098, dz = 0.627). However, the coefficient c for pooled data from both sides was not significantly different with the coefficient c on the paretic side for all cases (MG: p = 1.000, dz = 0.053; LG: p = 0.074, dz = 0.622; SOL: p = 0.109, dz = 0.666; ALL: p = 0.742, dz = 0.040).
FIGURE 6
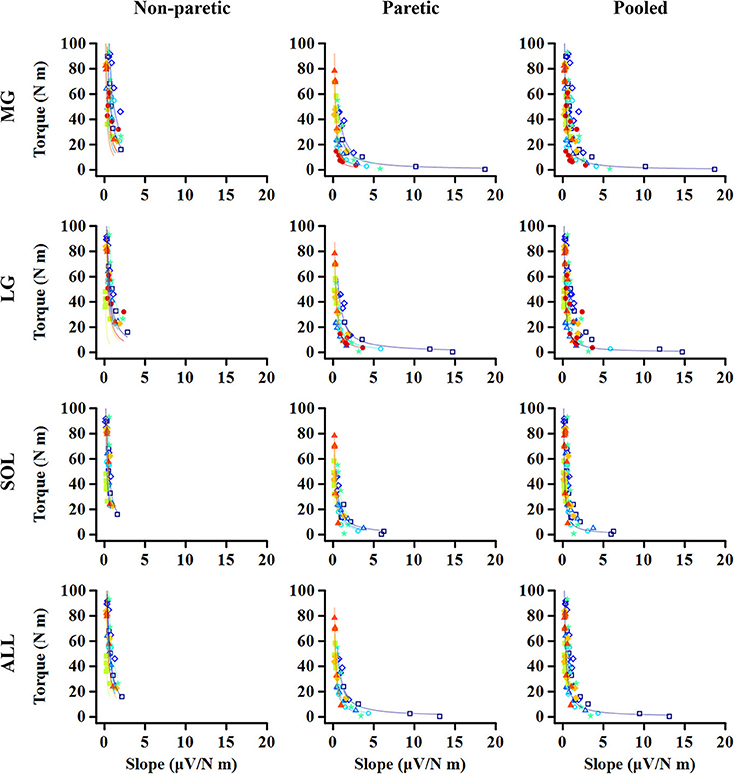 Figure 6. Relationship between maximum torque at
each ankle angle and EMG-torque slope at the corresponding angle. Note
that the greater slope, the smaller torque. The quicker decay in the
torque is shown on the paretic side than on the non-paretic side,
whereas there is no significant difference between the paretic and
pooled data. Markers and lines indicate raw data and fitted results from
each individual (in different colors), respectively.
Figure 6. Relationship between maximum torque at
each ankle angle and EMG-torque slope at the corresponding angle. Note
that the greater slope, the smaller torque. The quicker decay in the
torque is shown on the paretic side than on the non-paretic side,
whereas there is no significant difference between the paretic and
pooled data. Markers and lines indicate raw data and fitted results from
each individual (in different colors), respectively.
TABLE 2
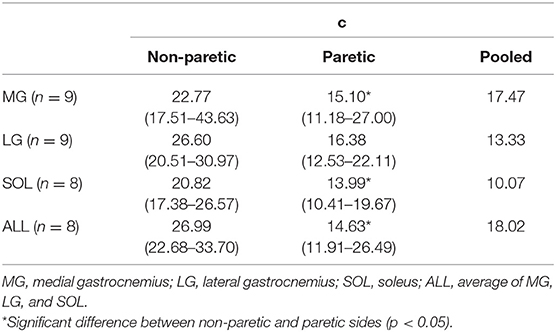 Table 2. The coefficient c values for normalized maximum plantarflexion torque at each joint angle (T) and slope of EMG-torque relations (S). T = cS−1.
Correlation Analysis
A strong linear relationship was observed between the relative coefficient a and the relative maximum torque for MG (r = 0.783; p = 0.017; Figure 7A), SOL (r = 0.762; p = 0.037; Figure 7C), and ALL (r = 0.881; p = 0.007; Figure 7D). However, no significant relationship was found for LG (r = 0.617; p = 0.086; Figure 7B).
FIGURE 7
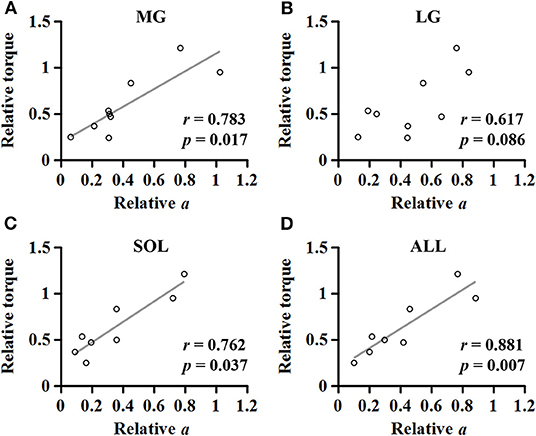 Figure 7. Relationship between the relative maximum torque and the relative coefficient a in medial gastrocnemius (A), lateral gastrocnemius (B), soleus (C), and the average of the muscles (D).
For the MG muscle, the relative coefficient a was smaller as the relative SWS measured at the neutral position was greater (r = −0.733; p = 0.031; Figure 8A). However, the relationship between the relative coefficient a and the relative muscle thickness was not significant (r = 0.017; p = 0.982; Figure 8B).
FIGURE 8
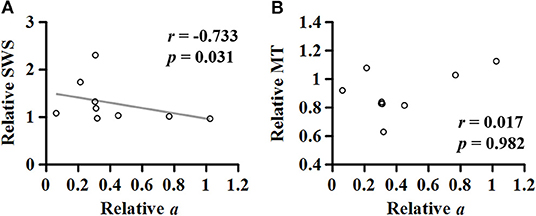 Figure 8. Relationship of the relative (non-paretic/paretic) coefficient a with the relative (paretic/non-paretic) shear wave speed (SWS) (A) or muscle thickness (MT) (B) measured in medial gastrocnemius.
Discussion
To summarize, the purpose of this study was to
investigate: (1) the effect of changes in ankle joint angles on the
muscular contraction efficiency of the calf muscles (i.e., the slope of
EMG-torque relations); (2) the relation between the maximum joint torque
at each joint angle and the EMG-torque slope at this angle; and (3) the
association between the relative coefficient a and the relative muscle
thickness or SWS. This is in order to understand the impact of intrinsic
muscular changes on muscular contraction efficiency after stroke.
Our results show that the paretic side has a greater slope coefficient a (i.e., more increment in the slope as a function of ankle plantarflexion angle) and smaller c
(i.e., steeper decay in the maximum torque as a function of the slope).
There was also a strong linear relationship between the relative joint
torque and the relative coefficient a, in the case of MG, SOL, or ALL.
For the MG muscles, the relative coefficient a (i.e., muscular contraction efficiency) was negatively correlated with the relative SWS (i.e., muscle stiffness).
No comments:
Post a Comment