Something is in here, but beyond my pay grade. And since my pay grade is zilch, that's not saying much for my intelligence.
Neurofunctional and neuroimaging readouts for designing a preclinical stem-cell therapy trial in experimental stroke
Scientific Reports volume 12, Article number: 4700 (2022)
Abstract
With the aim of designing a preclinical study evaluating an intracerebral cell-based therapy for stroke, an observational study was performed in the rat suture model of ischemic stroke. Objectives were threefold: (i) to characterize neurofunctional and imaging readouts in the first weeks following transient ischemic stroke, according to lesion subtype (hypothalamic, striatal, corticostriatal); (ii) to confirm that intracerebral administration does not negatively impact these readouts; and (iii) to calculate sample sizes for a future therapeutic trial using these readouts as endpoints. Our results suggested that the most relevant endpoints were side bias (staircase test) and axial diffusivity (AD) (diffusion tensor imaging). Hypothalamic-only lesions did not affect those parameters, which were close to normal. Side bias in striatal lesions reached near-normal levels within 2 weeks, while rats with corticostriatal lesions remained impaired until week 14. AD values were decreased at 4 days and increased at 5 weeks post-surgery, with a subtype gradient: hypothalamic < striatal < corticostriatal. Intracerebral administration did not impact these readouts. After sample size calculation (18–147 rats per group according to the endpoint considered), we conclude that a therapeutic trial based on both readouts would be feasible only in the framework of a multicenter trial.
Introduction
Ischemic stroke is a leading cause of mortality and disability worldwide1. To date, the only therapeutic option is to reopen the occluded artery mechanically and/or pharmacologically2. This option is applicable only in the acute phase for selected patients. In case of persisting disability, there is no treatment in the chronic phase to restore function, except rehabilitation.
Stem-cell therapy is a promising therapeutic option to restore function in the acute, subacute and chronic phases of ischemic stroke3,4,5. Mesenchymal stem cells are of major interest due to their low immunogenicity profile, good availability and absence of ethical concerns. These pluripotent cells have the capacity to differentiate into different cell types but their use is mainly based on their immunoregulatory properties. Adipose mesenchymal stem cells (ASCs) are the more accessible source compared to bone marrow mesenchymal stem cell6,7. Human adipose-derived mesenchymal stem cells (hASCs) are already used in stroke clinical trials (NCT03570450)8. However, the optimal route, time-window and cell dose still need to be determined in well-designed preclinical studies. Intracerebral injection seems to be the most efficient route in terms of preclinical treatment efficacy due to the direct delivery of stem cells but was mostly studied using cells of neural origins9. Although mesenchymal stem cells have been shown to differentiate into neurons10, the main rationale for administering them intracerebrally is to take advantage of their effects locally on the microenvironment, with the hope that it may foster regeneration, for instance by promoting neuronal stem cell migration and differentiation, producing trophic factors and modulating neuroinflammation11. Recent phase 0/1 clinical trials have also reported the safety of this administration route in patients in the chronic stage of stroke8,11,12. In this context, our global aim was to design a preclinical study to evaluate the effects of intracerebral administration of clinical-grade hASCs in ischemic stroke, with a study design that aligns with clinical functional evaluation methods for long-term recovery studies3,13.
As is well-known, there are several obstacles to the translation of stem-cell research in ischemic stroke from the preclinical to the clinical arena. The rigor of study design, the inclusion of different stroke subtypes, the choice of appropriate primary readout parameters and well-defined sample sizes have been identified as key factors to overcome the translational roadblock13,14,15,16,17. The assessment of neurofunctional outcome in chronic stroke patients relies on clinical scores such as the National Institutes of Health Stroke Scale (NIHSS)8 and the upper limb movement section of the Fugl–Meyer (FM) scale18,19. Combining clinical scores with the assessment of ipsilesional corticospinal tract (CST) remodeling with diffusion tensor imaging (DTI) can improve prediction of motor outcome19,20,21,22. Accordingly, our preclinical stem-cell trial aimed at combining neuroscores and the staircase test, a skilled reaching task that assesses forelimb function in rodent models14, with the DTI evaluation of CST structural integrity (internal capsule).
There is a plethora of studies in the literature that evaluate stem cell therapy in rodent models of ischemic stroke using neurofunctional and imaging outcomes5. However, despite international recommendations14,23, most of them do not perform a priori sample size calculation and include a limited number of animals per group (sometimes down to 5–6 animals per group24,25). Such studies are very likely to be underpowered26. Because of the bias to publish positive results only, this might result in overstatement of efficacy27. In this context, there is a need to improve the methodology of therapeutic preclinical trials. Ideally, a rigorous study design implies to thoroughly investigate these endpoints according to stroke subtype, in order to determine the optimal frequency of measurements, the post-stroke period during which data should be monitored, the quantitative modifications of readouts in time, and the within-laboratory variances. The specific aims of the present observational study with a limited number of subjects were threefold: (i) to characterize neurofunctional readouts (neuroscores and staircase test) and DTI metrics in the first weeks following transient middle cerebral artery occlusion (tMCAO) according to stroke subtype; (ii) to confirm that intracerebral administration of hASCs does not negatively impact these readouts (because of the invasiveness of the procedure); and (iii) to determine the most appropriate functional and imaging endpoints, at which time-points they should be evaluated, and to calculate the sample size required to achieve statistically significant differences with these endpoints for a preclinical exploratory therapeutic trial.
Results
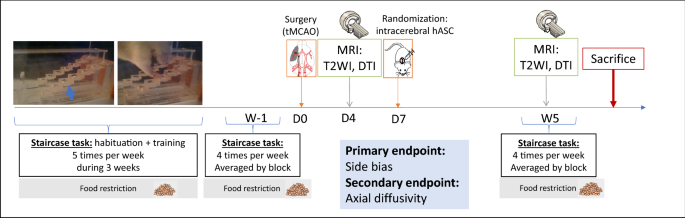
Figure 1 shows the experimental design of the study. Briefly, after a 3-week period of training at the staircase task, transient (60 min) middle cerebral artery occlusion was performed at day 0 (D0) (Fig. 1a). Neuroscores were obtained at D2 post-surgery (Fig. 1b). The staircase test was then performed at D4 (before baseline MRI) and D7 (before treatment administration). Baseline MRI, including T2-weighted imaging (T2WI) and diffusion tensor imaging (DTI) sequences, was performed at D4 post-surgery (Fig. 1b). Cerebral lesions were stratified into 3 subtypes according to their location on baseline MRI: corticostriatal, striatal or hypothalamic-only28. Half of the rats received clinical-grade hASCs intracerebrally at D7. All rats were then monitored for 5 weeks with longitudinal neurofunctional tests and MRI. By this time, most rats had completely recovered according to neurofunctional testing, except those with corticostriatal lesions; for these rats, follow-up was extended to week 14 (W14) (Fig. 1c).
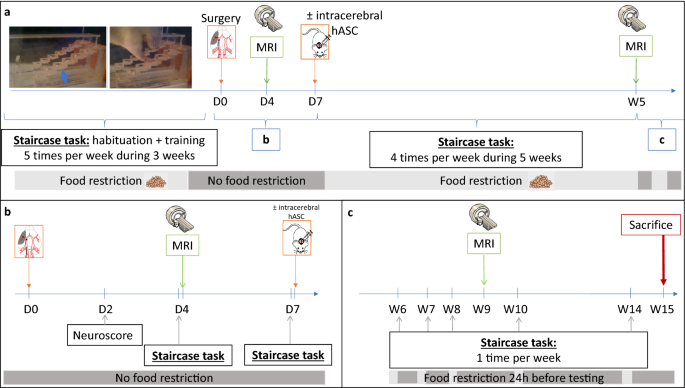
Study design. (a) Experimental design; (b) focus on the first week of the experiment; (c) focus on weeks 6 to 15: extended follow-up only for rats with corticostriatal lesions. D days, MRI magnetic resonance imaging, hASC human adipose mesenchymal stem cells, W Weeks.
Stroke subtypes
Supplementary Figure S1 presents the CONSORT-like chart of the study. Of the 25 rats trained at the staircase test, 18 matched the inclusion criteria and were thus selected to undergo surgery. Seven rats died before the end of the experiment: 2 during the surgical procedure, 4 in the first 24 h and 1 in the first 48 h post-surgery, the 5 latter probably due to malignant edema. Of the 11 rats included in the study, 4 had a corticostriatal lesion, 3 a striatal lesion and 4 a hypothalamic lesion (Fig. 2, Supplementary Fig. S1). Body weight changes over time were similar for these 3 groups (Supplementary Fig. S2). Five animals received intracerebral hASC treatment (Fig. 2, Supplementary Fig. S1).
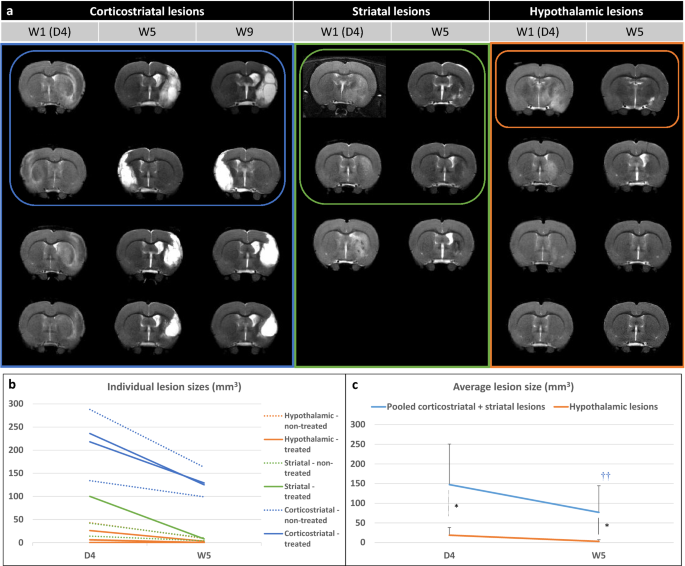
Evaluation of lesions on T2-weighted imaging. (a) Longitudinal T2-weighted imaging of all included rats according to lesion subtype (only one central slice is shown). Treated rats (that received intracerebral administration of hASCs) are presented in top rows and circled. (b) Individual lesion sizes are presented according to lesion subtype (striatal, corticostriatal and hypothalamic lesions) and treatment group (plain line: treated; dashed line: non-treated) at day 4 (D4) and week 5 (W5) post-surgery. (c) Average lesion sizes are presented according to lesion subtype: pooled (corticostriatal + striatal) vs hypothalamic lesions. Data are displayed as mean ± SD. W weeks, D days; *p < 0.05, (corticostriatal + striatal) vs hypothalamic, Wilcoxon–Mann–Whitney test; †p < 0.05, ††p < 0.01, W5 vs D4, Friedman test.
Neurofunctional readouts
Staircase test
Figure 3a presents individual results for side bias according to lesion subtype and treatment group. Rats were slightly lateralized before surgery (side bias: 66% [56%; 66%]). Side bias in the hypothalamic-only lesion group was maintained around 50% (i.e., no difference between right and left paw performances) right after surgery and until the end of testing. In rats with striatal and corticostriatal lesions, side bias was severely increased in the first days after stroke (i.e., marked difference in favor of the ipsilateral paw). Rats with striatal lesions recovered nearly to the level of rats with hypothalamic lesions at W2, while rats with corticostriatal lesions remained severely impaired until W5 (Fig. 3a; W5: 6% [4%; 10%] for corticostriatal lesions vs 41% [39%; 48%] for striatal lesions and 51% [50%; 55%] for hypothalamic-only lesions). The changes in time in the number of pellets taken by the control non-affected paw was similar for rats with corticostriatal, striatal and hypothalamic lesions, thus suggesting that motivation to reach and eat pellets was the same for each time point, regardless of lesion subtype (Supplementary Fig. S2). Staircase performance remained low until W14 in rats with corticostriatal lesions (Supplementary Fig. S3). Intracerebral administration of hASCs did not negatively impact staircase test performance (Table 1).
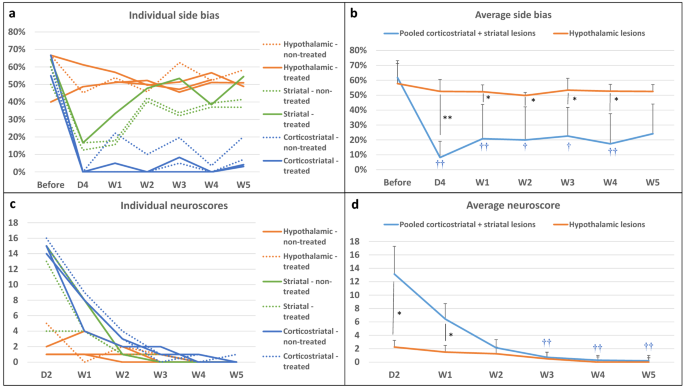
Neurofunctional readouts. (a) Individual side bias according to lesion subtype and treatment group (plain line: treated; dashed line: non-treated) in the first 5 weeks post-surgery. (b) Average side biases according to lesion subtype: pooled (corticostriatal + striatal) vs. hypothalamic lesions. (c) Individual neuroscores according to lesion subtype and treatment group (plain line: non-treated; dashed line: treated) in the first 5 weeks post-surgery. (d) Average neuroscores according to lesion subtype: pooled (corticostriatal + striatal) vs. hypothalamic lesions. Data are displayed as mean ± SD. W weeks, D days. *p < 0.05, **p < 0.01, (corticostriatal + striatal) vs. hypothalamic, Wilcoxon–Mann–Whitney test; †p < 0.05, ††p < 0.01, D4 to W5 vs. before, Friedman test.
Because hypothalamic lesion did not have a neurofunctional impact on the staircase test, rats with hypothalamic-only lesions were assimilated to sham-like animals, while rats with striatal and corticostriatal lesions were considered as tMCAO rats and pooled for performing statistical analysis between 2 groups (N = 7 (corticostriatal + striatal) lesions vs N = 4 hypothalamic-only lesions). There was no difference in side bias across time in the hypothalamic-only lesion group (Friedman test—p = 0.8291), contrary to the pooled (corticostriatal + striatal) lesion group (Friedman test—p = 7.266e−05). Post-surgery side biases were statistically lower from pre-surgery ones, except at W5 (post-hoc Conover test—D4: p = 0.0002; W1: 0.0090; W2: 0.0249; W3: 0.0357; W4: 0.0080; W5: 0.1154). Side bias was statistically lower in pooled (corticostriatal + striatal) lesion group than in hypothalamic-only lesion group at all time-points, except before surgery (Fig. 3b; Wilcoxon–Mann–Whitney test—Before surgery: p = 1; D4: p = 0.0088; W1: p = 0.0105; W2: p = 0.0171; W3: p = 0.0424; W4: p = 0.0100; W5: 0.0424).
Neuroscores
Figure 3c,d present individual and averaged neuroscores according to lesion subtype and treatment group. Intracerebral administration of hASCs did not aggravate neuroscores (Table 1). At D2, neuroscores were in the same order of magnitude in rats with striatal lesion (13 [9; 14]) and rats with corticostriatal lesion (15 [15; 15]), while rats with hypothalamic-only lesion had much lower neuroscores (2 [1; 3]) (Fig. 3c), thus confirming our previous observations with regard to rats with hypothalamic-only lesions behaving as sham-like animals. There was a significant difference in neuroscores across time in the hypothalamic-only lesion group (Friedman test—p = 0.02727); however, none of the Conover post-hoc test were significant. In the pooled (corticostriatal + striatal) lesion group, the difference in neuroscores across time was statistically different (Friedman test—p = 4.897e−06), with W3, W4 and W5 neuroscores that were statistically lower than D2 neuroscores (Conover post-hoc test—W1: p = 0.3998; W2: 0.0955; W3: 0.0055; W4: 0.0015; W5: 0.0011). There was a statistically significant difference between the 2 groups at D2 that was attenuated but maintained at W1 (Fig. 3d; Wilcoxon–Mann–Whitney test—D2: p = 0.0168; W1: p = 0.0188). Starting at W2, neuroscores were no longer significantly different between groups, as all neuroscores had reached sham-like levels (Fig. 3d; Wilcoxon–Mann–Whitney test—W2: p = 0.3276; W3: p = 0.754; W4: p = 0.3241; W5: p = 0.5708).
Imaging readouts
Brain lesions
Figure 2b,c show individual and average lesion sizes according to lesion subtype and treatment group. As expected, at D4, there was a gradient in lesion size according to subtype (D4: hypothalamic-only: 16 [5; 30] < striatal: 42 [28; 71] < corticostriatal: 227 [197; 249] mm3 and W5: hypothalamic-only: 2 [0; 5] < striatal: 8 [6; 9] < corticostriatal: 127 [119; 138] mm3). Corticostriatal lesion volumes remained stable after W5 (Supplementary Fig. S3; W9: 124 [111; 141] mm3). Intracerebral administration of hASCs did not impact lesions sizes (Table 1). Lesion shrinkage between D4 and W5 was statistically significant in pooled (corticostriatal + striatal) lesion group (Friedman test—p = 0.0081) but not in hypothalamic-only lesion group (Friedman test—p = 0.0832). Lesion size was statistically larger in pooled (corticostriatal + striatal) lesion group than in hypothalamic-only lesion group at both time-points (Fig. 2c; Wilcoxon–Mann–Whitney test—D4: p = 0.0424 and W5: 0.0293).
Microstructural alterations
The internal capsule appeared as a region characterized by a high fractional anisotropy (FA) value localized between the lateral ventricle and the caudate putamen (Fig. 4a, white arrows). Supplementary Figure S4 and Fig. 4b–e present individual and average DTI metrics (MD: mean diffusivity, AD: axial diffusivity and RD: radial diffusivity) according to lesion subtype and treatment group. DTI metrics were not impacted by intracerebral administration of hASCs (Table 1). DTI metrics did not change over time in the contralateral internal capsule in hypothalamic-only lesion group (Friedman test—FA: p = 1; MD: p = 0.3173; AD: 0.3173; RD: 0.5637) and in pooled (corticostriatal + striatal) lesion group (Friedman test—FA: p = 0.2568; MD: 0.4142; AD: 0.2568; RD: 1). Also, there was no significant difference between these 2 groups in the contralateral internal capsule at D4 (Wilcoxon–Mann–Whitney test—FA: p = 0.5273; MD: p = 0.769; AD: 0.5044; RD: 0.6311) and W5 (Wilcoxon–Mann–Whitney test—FA: p = 0.3152; MD: p = 0.3028; AD: 0.1829; RD: 0.7035) (Supplementary Fig. S4, Fig. 4b–e). In the ipsilesional internal capsule, FA and MD were significantly decreased at D4 in the pooled (corticostriatal + striatal) lesion group compared to the hypothalamic-only lesion group (Fig. 4b,c; Wilcoxon–Mann–Whitney test—FA: p = 0.0060 and MD: p = 0.0363, represented by *). FA and AD were significantly increased in the ipsilesional and internal capsule at W5 vs. D4 (represented by †) in both hypothalamic-only lesion group (Friedman test—FA: p = 0.0455 and AD: p = 0.0455) and (corticostriatal + striatal) lesion group (Friedman test—FA: p = AD: p = 0.0081). MD was significantly increased at W5 vs. D4 in the (corticostriatal + striatal) lesion group only (Friedman test—p = 0.0081). FA was significantly decreased in the ipsilesional vs. contralesional internal capsule (represented by ‡‡) at D4 in (corticostriatal + striatal) lesion group (Friedman test—p = 0.0081). At W5, it was significantly increased in the ipsilesional vs. contralesional internal capsule both in hypothalamic-only lesion group (Friedman test—p = 0.0455) and in (corticostriatal + striatal) lesion group (Friedman test—p = 0.0081). AD was also significantly increased in the ipsilesional vs. contralesional internal capsule both in hypothalamic-only lesion group (Friedman test—p = 0.0455) and (corticostriatal + striatal) lesion group (Friedman test—p = 0.0081) at W5. In rats with a corticostriatal lesion, FA remained relatively stable in the ipsilesional internal capsule while MD, AD and radial diffusivity (RD) continued to increase at W9 (Supplementary Fig. S3).
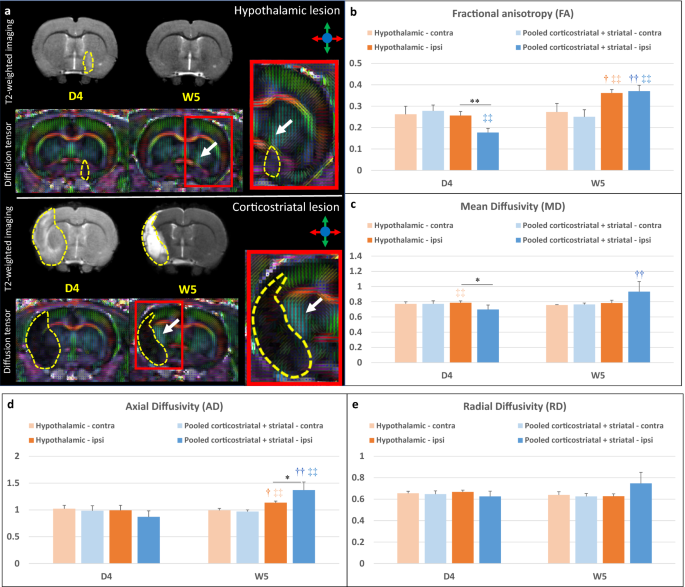
DTI readouts. (a) Example of T2-weighted imaging and color-coded fractional anisotropy for two individual rats: one with a hypothalamic lesion and one with a corticostriatal lesion (dotted yellow line). Only the central slice is presented. The internal capsule is pointed out by the white arrow. (b–e) Average DTI metrics (respectively FA, MD, AD and RD) are presented according to lesion subtype: pooled (corticostriatal + striatal) vs. hypothalamic lesions at day 4 (D4) and week 5 (W5) post-surgery. FA fractional anisotropy, MD mean diffusivity, AD axial diffusivity, RD radial diffusivity. *p < 0.05, **p < 0.01, (corticostriatal + striatal) vs. hypothalamic, Wilcoxon–Mann–Whitney test; †p < 0.05, ††p < 0.01, W5 vs. D4, Friedman test; ‡p < 0.05, ‡‡p < 0.01, ipsilateral (ipsi) vs. contralateral (contra) side, Friedman test.
Post-mortem analysis
An increase in the internal capsule thickness was clearly seen in the ipsilesional side (Supplementary Fig. S5). The cellularity was enhanced in the ipsilesional internal capsule as seen by the increased number of nucleus compared to the contralateral side, which suggest the presence of inflammatory cells. CD68-positive cells (for macrophages) were not seen in the internal capsule and mainly found in the perilesional area. A high density of GFAP-positive cells was also observed in the perilesional area, corresponding to the glial scar. GFAP is expressed constitutively in astrocytes as seen in the contraleral internal capsule with a typical ramified morphology. In the ipsilesional internal capsule, GFAP staining was present in association with numerous nucleus suggesting astrogliosis. In addition, astrocytes presented a reactive phenotype compared to the control side.
Therapeutic trial design
Correlation between imaging and neurofunctional readouts
Several correlations were observed between imaging and neurofunctional readouts. Neuroscores at D1 and side bias at W5 were linearly related to lesion size at D4 (Supplementary Fig. S6). Figure 5 shows the most significant correlations between side bias and DTI metrics. AD at W5 correlated with neuroscore at day 2 (Fig. 5a; Pearson’s correlation—p = 3.65e−05) and with side bias at W1 (Fig. 5b; Pearson’s correlation—p = 0.0002) and W5 (Fig. 5c; Pearson’s correlation—p = 0.0003). Hence this parameter seemed the most relevant for detecting a treatment effect.
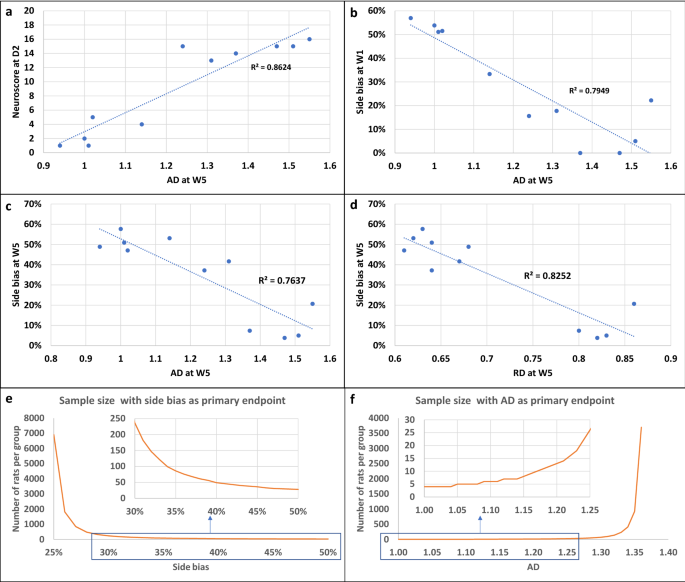
Correlations between neurofunctional and imaging outcomes and sample size calculation. (a–d) Main correlations between neurofunctional and imaging readouts. (a) Correlation between neuroscores at D2 and AD at D5 (Pearson correlation test, p = 3.65e−05). (b) Correlation between side bias at W1 and AD at W5 (Pearson correlation test, p = 0.00022). (c) Correlation between side bias at W5 and AD at W5 (Pearson correlation test, p = 0.00034). (d) Correlation between side bias at W1 and RD at W5 (Pearson correlation test, p = 6.543e−05). (e,f) Sample size calculation for future pre-clinical therapeutic trial. (e) Side bias as primary endpoint. The x-axis represents the hypothesized value of side bias in the treatment group and the y-axis represents the corresponding number of rats per group. (f) AD as primary endpoint. The x-axis represents the hypothesized value of AD in the treatment group and the y-axis represents the corresponding number of rats per group. AD axial diffusivity, RD radial diffusivity.
Sample size calculation
To assist in the design of future therapeutic trials, we performed calculations using our data to determine sample size in order to detect a deficit in treated compared to non-treated tMCAO rats at W5 after stroke. We assumed that the tMCAO group included corticostriatal and striatal lesions and excluded hypothalamic-only lesions. The primary endpoints were side bias (Fig. 5e) and the DTI metric AD (Fig. 5f). For the staircase test, we assumed a side bias value of 24% ± 20% in the non-treated tMCAO group (i.e., mean ± SD from the pooled (corticostriatal + striatal) lesion group of the current study at W5). The side bias in the treated group was then varied from 25 to 50% (corresponding to hypothalamic-only lesion levels at W5) by steps of 1% and sample size was calculated for each side bias (Fig. 5e). For side bias increasing from 24% to 32% (30% improvement in side bias), sample size needs to be 147 rats per group in order to detect a significant difference between groups. For side bias increasing from 24% to 36% (50% improvement in side bias, i.e. to reach the level of rats with striatal lesions), sample size needs to be 76 rats per group. For DTI metrics, we assumed an AD value of 1.37 ± 0.15 in the non-treated group (i.e., mean ± SD from the pooled (corticostriatal + striatal) lesion group of the current study at W5). AD in the treated group was then varied from 1.36 to 0.99 (corresponding to contralateral hypothalamic-only lesion levels at W5) by steps of 0.01 and sample size was calculated for each AD value (Fig. 5F). For an AD value decreasing from 1.37 to 1.23 (10% improvement in AD value, reaching the level of rats with striatal lesions), sample size needs to be 18 rats per group. For an AD value decreasing from 1.37 to 1.16 (15% improvement in AD value, i.e. to reach an intermediate value between rats with striatal and hypothalamic lesions), sample size needs to be 9 rats per group only.
Discussion
We here report an observational, descriptive study aiming to design a larger-scale therapeutic trial to evaluate intracerebral administration of hASCs in the chronic stage of ischemic stroke. Figure 6 summarizes the final protocol design.
Design of preclinical therapeutic trial. The study design involves 2 staircase tasks (one before tMCAO surgery and one 5 weeks after, i.e. 4 weeks post-treatment) and 2 MRIs with T2-weighted imaging and DTI sequences (one at D4 post-surgery and one at 5 weeks after tMCAO surgery, i.e. 4 weeks post-treatment).
Although such preclinical trials have already been published in the literature29,30,31, several methodological aspects, including choice of biomarkers, need to be considered to produce robust data that may be translated to the clinical realm. We chose to model ischemic stroke in rats using transient occlusion of the middle cerebral artery with an intraluminal thread. This model produces cerebral damage with a variety of lesion sizes and anatomical locations (hypothalamus, striatum and cortex)28, as is common in ischemic stroke patients15. Because lesion location, in addition to lesion size, is a main determinant of functional outcome, we reported our results according to these 3 lesion subtypes.
Long-term neurofunctional tests remain a challenge due to the quick compensation of rodents and the difficulty to differentiate adaptive strategy from motor improvement13,32,33. The test must be quantitative, allow repetition and it must reveal long term and stable deficits with enough sensitivity to show an improvement in treated vs non-treated subjects34,35. The staircase test, a skilled reaching task that assesses forelimb function, fulfills these criteria for the long-term evaluation of motor recovery in stroke-induced rats36,37. However, the optimal frequency of testing, the timescale and side bias modifications in time still remained to be determined38,39,40,41. Our results confirm that the staircase test is an appropriate neurofunctional biomarker for the long-term evaluation of rats with corticostriatal and striatal lesions. To the best of our knowledge, this is the first study to report detailed changes in side bias over time according to lesion subtype using the tMCAO intraluminal thread model. Because of the heterogeneity between striatal and corticostriatal lesions, the number of subjects per group to detect a side bias difference in a stem-cell trial is relatively high (76–147 rats per group). This is not unfeasible but necessitates a multicenter design, probably including at least 5 centers, as in Ref.42. Because animals with corticostriatal and striatal lesions present different sensorimotor deficits and recovery, complementary analysis may need to be performed in these subgroups, provided that the number of included animals provides sufficient statistical power. Alternatively, pre-treatment T2WI may be used to include rats with corticostriatal lesions only, in order to reduce variability and hence sample size. This might be relevant for translational research, as half of stroke patients experience persistent loss of upper-limb function in the chronic stage16.
One limitation of the staircase test is that it requires intensive training and is prone to large exclusion rates of low-learner rats37. In addition, implementation and analysis are quite strenuous and time-consuming. Hence we aimed at simplifying the neurofunctional follow-up. As side bias remained stable in all groups 2 weeks after tMCAO, a single week of testing (with block averaging) may be sufficient to assess stem-cell treatment effects. We suggest choosing W5, because we found no further spontaneous improvement after this stage, while a follow-up of at least one month after treatment is usually recommended for stem-cell studies34,43. Another limitation of the staircase test is the necessity of food restriction to favor motivation. Some recent reports have shown a neuroprotective effect of food restriction44,45 so food restriction may induce a bias when evaluating stroke recovery. Nevertheless, both body weights and motivation was found to be similar at all time-points for the 3 groups of lesion subtypes thus suggesting that that bias did not differently impact animals from the different groups.
Advanced neuroimaging modalities such as DTI are commonly used in clinical stroke research as complementary outcome measures to neurofunctional evaluation19. Axial diffusivity appeared to be the most relevant parameter. We observed a decrease (although not significant) in AD in the ipsilesional internal capsule in the acute stage of ischemic stroke and a significant increase in the chronic stage. There was also a trend toward an increase in RD in the chronic stage in the ipsilesional internal capsule. This is consistent with acute axonal damage followed by chronic axon and myelin damage46. Post-mortem immunohistological data also suggested the potential sensitivity of DTI metrics to glial activation as already reported in the literature47. The hypothesis to test in a stem cell trial would be that CST microstructural remodeling and immunomodulation by treatment ‘normalizes’ the AD value. Because DTI metrics are quite consistent over time and across animals, the number of subjects per group if this metric is used as a primary endpoint (N = 9–18 according to the expected size effect) would be compatible with a single-center exploratory study. However, such a study would be underpowered to evaluate side bias at the same time, and should therefore be considered preliminary.
We did not observe any impact of intracerebral administration on neurofunctional and imaging readouts. This is important to report as the main drawback of this route of administration is its invasiveness. We thus confirm the safety of the procedure. On the other hand, there was no trend toward an improvement of any of the endpoints evaluated in the group of rats that were injected with hASC compared to those who were not. Although the study was not powered to detect such an effect, this suggests that cell therapy regimen may benefit from being optimized before proceeding to the larger-scale preclinical trial. In particular, perilesional rather than intra-striatal administration of hASC may provide better efficacy.
The main limitation of the present study was the small number of animals that were included. This was due in part to a mortality rate that was higher than expected, probably due to complications such as hemorrhagic transformation and malignant edema that are difficult to anticipate. Exclusion rates are rarely reported in stroke research, which actually represents one of the methodological flaw of preclinical studies. Basalay et al. recently reported a 25% exclusion rate at 24 h post-surgery due to the combination of mortality rate and hemorrhagic transformations in a bicentre international study using the same tMCAO model in rats48. For long-term studies, the mortality rate is increased as seen in the current study, where the mortality post-surgery exceeded our a priori hypothesis: this is a further element to be taken into account when designing a therapeutic trial to reach the adequate statistical power. Nevertheless, the study was designed as an observational study, results are shown for individual animals and statistical analysis was performed between pooled (corticostriatal and striatal lesions) lesions and sham-like (hypothalamic lesions) groups only. We therefore believe these results are robust and that they are of interest to the stroke community by addressing the need to standardize preclinical stem-cell trials and design high-quality studies. The next step will be to validate the selected neurofunctional and imaging readouts in a larger exploratory study.
Conclusion
This study determined the optimal neurofunctional and imaging readouts for the follow-up of rats in the chronic stage of ischemic stroke, the relevant timescale, and adequate sample size to evaluate the therapeutic effects of intracerebral administration of hASCs, in line with international recommendations34. We conclude that an exploratory preclinical trial based on both readouts would be feasible only in the framework of a multicenter trial, which in turn would necessitate appropriate funding and/or an industrial partnership. Such rigorous approaches are paramount for the successful translation of preclinical stem-cell research for the benefit of stroke patients.
No comments:
Post a Comment