Animals
Adult common marmosets (Callithrix jacchus > 18 months; n = 15 fixed, n = 16 fresh, n = 6
for transcriptomics) were used in this study. Animals were subdivided
into uninjured control and injured cohorts, comprising 1, 7, 14, and
21 days post-injury (DPI) recovery periods (fixed: n = 3 per time point; fresh: n = 3 per time point, excluding 14 DPI, where n = 4). n = 3 for transcriptomics were allocated to the 7 DPI recovery period and n = 3
uninjured marmosets were used as control. Experiments were conducted
according to the Australian Code of Practice for the Care and Use of
Animals for Scientific Purposes and were approved by the Monash
University Animal Ethics Committee. Animals were obtained and housed at
the National Nonhuman Primate Breeding and Research Facility (Monash
University).
ET-1-induced focal ischemic stroke
Preoperative procedures, anesthesia and surgery were all performed on adult marmoset monkeys2.
In short, anesthesia was induced using Alfaxalone (5 mg/kg) and
maintained using inspired isoflurane (0.5-4%) throughout all surgical
procedures. Induction of focal ischemic injury to adult marmoset primary
visual cortex (V1) was achieved by vasoconstrictor-mediated vascular
occlusion of the calcarine branch of the posterior cerebral artery,
which supplies operculum V1. Following midline incision, craniotomy, and
dural resection, intracortical injections of endothelin-1 (ET-1:
1 mg/mL; rate: 0.1 µL/30 s pulse + 30 s intervals, totaling 0.7 µL over
seven sites) proximal to the PCAca were performed. Upon completion of
injections, the craniotomy was replaced and positioned with tissue
adhesive (Vetbond 3 M) and the skin sutured closed. Uninjured animals
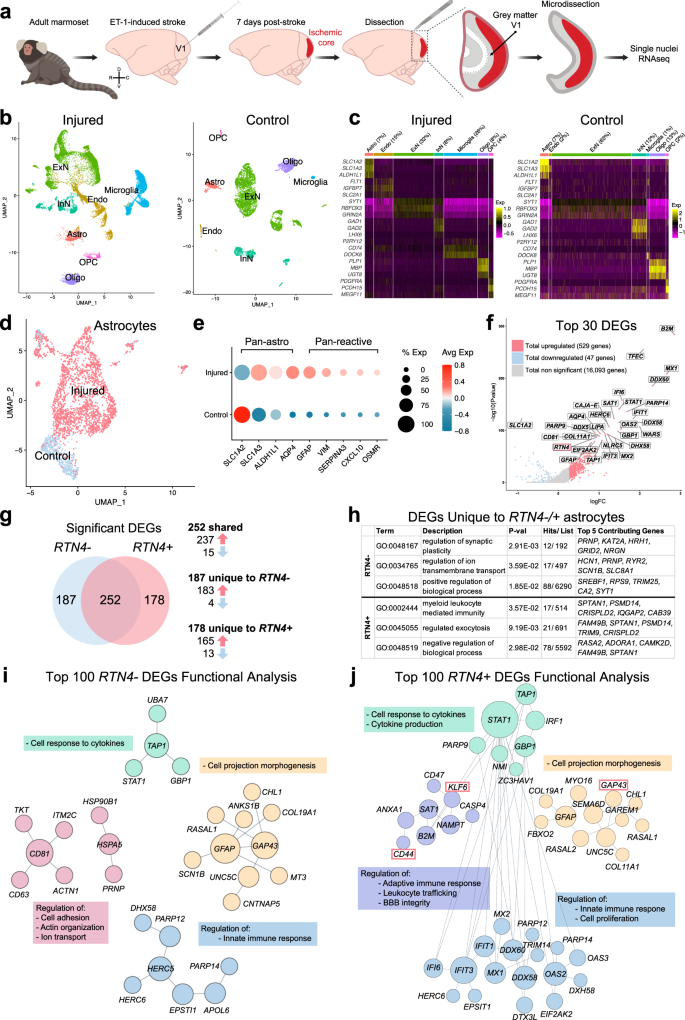
were used as controls. Stroke model is summarized in Fig. 1a and Supplementary Fig. 1a.
Single nuclei 10x genomic sequencing and analysis
Adult marmosets in both injured (1-week post-ET-1-induced ischemic stroke, n = 3) and uninjured cohorts (control, n = 3)
were administered an overdose of sodium pentobarbitone (100 mg/ kg;
IM). Following the loss of corneal and muscular reflexes, the animals
were decapitated, and the brain removed under aseptic conditions.
Cerebral tissues were rinsed in chilled PBS to remove excess blood,
before microdissection of regions of interest within V1, including
operculum V1 but excluding calcarine V1 and associated white matter
(Fig. 1a).
In stroke animals, this also included the core and penumbra. Dissected
tissues were placed in sterile tubes and dropped into liquid nitrogen
before storage at −80 °. The procedures/ dissections were performed in
chilled RNAase-free PBS with RNase-free sterilized instruments under
RNase-free conditions. Approximate time from apnea to snap-freezing
ranged from 20–30 m. All six samples passed QC.
Nuclei Isolation
All
buffers were ice-cold and all reagents used for consequent nuclear
isolation were molecular biology grade unless stated otherwise.
Frozen
cerebral tissues from the injured cohort were finely pulverized to
powder in liquid nitrogen with mortar and pestle (Coorstek #60316,
#60317). 50 mg of pulverized tissue was added into 5 mL of ice-cold
lysis buffer: 320 mM sucrose (Sigma #S0389), 5 mM CaCl2 (Sigma #21115), 3 mM Mg(Ace)2
(Sigma #63052), 10 mM Tris-HCl (pH 8) (AmericanBio #AB14043), protease
inhibitors w/o EDTA (Roche #11836170001), 0.1 mM EDTA (AmericanBio
#AB00502), RNAse inhibitor (80 U/mL) (Roche #03335402001), 1 mM DTT
(Sigma #43186), 0.1% TX-100 (v/v) (Sigma #T8787). Reagents: DTT, RNAse
Protector, protease inhibitors, TX-100 were added immediately before
use. The suspension was transferred to Dounce tissue grinder (15 mL
volume, Wheaton #357544; autoclaved, RNAse free, ice-cold) and
homogenized with loose and tight pestles, 30 cycles each, with constant
pressure and without introduction of air. The homogenate was strained
through 40 um tube top cell strainer (Corning #352340) which was
pre-wetted with 1 mL isolation buffer: 1800 mM sucrose (Sigma #S0389),
3 mM Mg(Ace)2 (Sigma #63052), 10 mM Tris-HCl (pH 8)
(AmericanBio #AB14043), protease inhibitors w/o EDTA (Roche
#11836170001), RNAse inhibitor (80 U/mL) (Roche #03335402001), 1 mM DTT
(Sigma #43186). Additional 9 mL of isolation buffer was added to wash
the strainer. Final 15 mL of solution was mixed by inverting the tube
10x and carefully pipetted into two ultracentrifuge tubes (Beckman
Coulter #344059) onto the isolation buffer cushion (5 mL) without
disrupting the phases. The tubes were centrifuged at 30000 × g,
for 60 min at 4 °C on ultracentrifuge (Beckman L7-65) and rotor (Beckman
SW41-Ti). Upon end of ultracentrifugation, the supernatant was
carefully and completely removed and 100 ul of resuspension buffer
(250 mM sucrose (Sigma #S0389), 25 mM KCl (Sigma #60142), 5 mM MgCl2
(Sigma #M1028), 20 mM Tris-HCl (pH 7.5) (AmericanBio #AB14043; Sigma
#T2413), protease inhibitors w/o EDTA (Roche #11836170001), RNAse
inhibitor (80 U/mL) (Roche #03335402001), 1 mM DTT (Sigma #43186)) was
added dropwise on the pellet in each tube and incubated on ice for
15 min. Pellets were gently dissolved by pipetting 30x with 1 mL pipette
tip, pooled and filtered through 40 um tube top cell strainer (Corning
#352340). Finally, nuclei were counted on hemocytometer and diluted to 1
million/mL with sample-run buffer: 0.1% BSA (Gemini Bio-Products
#700-106 P), RNAse inhibitor (80 U/mL) (Roche #03335402001), 1 mM DTT
(Sigma #43186) in DPBS (Gibco #14190).
Frozen cerebral tissues
from the control cohort were homogenized using a glass Dounce tissue
grinder (2 mL volume, Sigma, Kimble #D8938-1SET) with loose and tight
pestles, 25 cycles each, in 2 mL ice-cold lysis buffer (Nuclei PURE
Lysis buffer (Sigma #NUC201-1KT) + 0.1% NP40 (Invitrogen
#FNN0021) + RNAse inhibitor (Invitrogen #10777-019). Following
homogenization, an additional 2 mL of ice-cold lysis buffer was added
and the homogenates were incubated on ice for 5 min. The homogenates
were then transferred to 15 mL tubes and centrifuged at 500 × g for
5 min at 4 °C. The supernatant was subsequently removed and discarded.
The remaining pellets were then washed with 3 mL ice-cold lysis buffer
and incubated on ice for 5 min. After another round of centrifugation,
the nuclei were washed in 2 mL nuclei resuspension buffer (NSB:
Dulbecco’s phosphate-buffered saline + 1% BSA (Ambion #AM2616) + 1x
Proteinase inhibitor (Roche #11836153001) + 0.2 U/µL RNAse inhibitor
(Invitrogen #10777-019) and centrifuged again for another 5 min with the
same parameters. Isolated nuclei were resuspended in 500 µL NSB or
approximately 5 million/400 µL, factoring in 30% cell loss from
centrifugation. Nuclei were then filtered through a 30 µm cell strainer
and counted with Trypan blue using a hemocytometer. Nuclei were
subsequently stained with Hoechst 333258 at 1:1000, then processed
through FACs analysis/ sorting (Influx3, 70 µm nozzle, PSI 20; with
nuclei present in approximately 5–20% of events). DAPI + nuclei were
then sorted into a collection tube containing NSB with RNAse inhibitor
(Invitrogen #10777-019) at a concentration of 1000 nuclei/µL.
Single cell/nucleus microfluidic capture, cDNA synthesis and RNAseq library preparation
The
nuclei from the injured cohort were placed on ice and taken to Yale
Center for Genome Analysis core facility, and the nuclei from the
control cohort were placed on ice and taken to Micromon Genomics
facility, each for single nucleus RNA sequencing. Samples were processed
within 15 min with targeted nuclei recovery of 10,000 nuclei per
sample. Nuclei suspensions were packaged into single-nuclei beads and
the cDNA libraries were constructed using Chromium Single Cell 3' v3
Chemistry (10x Genomics) on microfluidic Chromium System (10x Genomics)
by following precisely manufacturers detailed protocol
(CG000183_ChromiumSingleCell3’_v3_UG_RevA). Specifically, due to
limitations imposed by source RNA quantity, cDNA from nuclei was
amplified for 8–14 cycles.
Sequencing of libraries
In
order to reach optimal sequencing depth (25,000 raw reads per nucleus),
single cell and/or nucleus libraries were run using paired-end
sequencing with single indexing on the HiSeq 4000 platform (Illumina) by
following manufacturer’s instructions (Illumina, 10x Genomics)
(CG000183_ChromiumSingleCell3’_v3_UG_RevA). To avoid lane bias, multiple
uniquely indexed samples were mixed and distributed over several lanes.
Similarly,
sequencing of the control cohort aimed to reach a sequencing depth of
25,000 raw reads per nucleus by running single-end sequencing of 98b
reads in two sequencing lanes (FCL) for at least 400 m raw reads per
lane using MGITech MGISEQ2000RS platform via MGIEasy V3 chemistry.
Cell de-multiplexing, reads alignment and gene expression quantification
First, the cellranger mkfastq86
was used to demultiplex the raw base call (BCL) files obtained from
Illumina HiSeq 4000 sequencers into FASTQ files. Second, the cellranger mkref was used to build a reference index for the marmoset reference genome (calJac3), and the GTF format Ensembl87
gene annotation (Callithrix_jacchus.C_jacchus3.2.1.91.gtf) was
processed to the transcriptional model specified for single nuclei
sequencing. Third, the cellranger count was used to perform read
alignments to the reference genome, cell filtering and counting, and
gene UMI quantification for every single cell. Notably, all parameters
of cellranger were set as default, except for “–expect-cells = 10,000”.
Removal of nuclei doublets
For the injured cohort, nuclei doublets or clumps were removed through post-transcriptomic analysis, using Scrublet88 software with a filtered feature barcode matrix (i.e., matrix.mtx) generated by cellranger as input. To optimize the analysis, we customized some parameters based on in-house computing trials, i.e., expected_doublet_rate = 0.05, min_counts = 2, min_cells = 3, min_gene_variability_pctl = 85, n_prin_comps = 30.
For
the control cohort, Seurat’s standard pre-processing and quality
control workflow was followed to remove low-quality cells, empty
droplets, cell doublets, and multiplets89.
To optimize the analysis, the QC metrics were customized
(200 > nFeature_RNA < 2500) based on the distribution of
features-counts.
Data analysis and mining
During
the first stages of analysis, injured and control datasets were
processed separately. For each dataset, raw gene UMI counts per nuclei
were recorded in a matrix format before being used to create a Seurat object, followed by log normalization using NormalizeData function with setting parameters normalization.method = “LogNormalize”, scale.factor = 10,000.
To improve the signal-to-noise ratio, and produce robust and reliable
results for downstream analyses, we identified highly variable genes
(HVGs) using Seurat FindVariableFeatures function by choosing parameters selection.method = “vst”, nfeatures = 3000.
To achieve this goal, we fit the relationship between log-transformed
variance and log-transformed mean of gene UMI counts using local
polynomial regression, and then chose the 3000 top-ranked genes as HVGs,
which were scaled subsequently using ScaleData to feed the
request from gene dimension reduction and cell clustering. For gene
dimension reduction, the first step used principle component analysis
(PCA) via a linear dimension reduction approach, which was implemented
by using the Seurat RunPCA function and consequently choosing the
top 50 principal components (PCs) to represent cell variation. The
second step used uniform manifold approximation and projection (UMAP)90 to complete further dimension reduction of the top 30 PCs generated in the first step. Finally, we used the Seurat FindClusters function with parameters (i.e., dims = 1:30, resolution = 1)
to analyze nuclei clustering. This method was used to identify major
nuclei clustering that would ultimately be associated with the main cell
type. Subsequent clustering to look for subclusters within cell types
was not performed for this study.
Assignment of cell type
In
order to identify and isolate astrocytes, nuclei clusters were matched
to specific cell types by calculating gene specificity scores for each
gene in each cluster using the R script retrieved from Efroni, Ip91 or using FindMarkers with the test.use = ”roc” parameter89.
Genes with the highest specificity scores or roc scores suggested
enrichment and were consequently considered as cluster-specific markers,
which would be compared with the literature of reported cell type
markers to assign a cell type to each cluster. Cell-type markers were as
follows: astrocyte (SLC1A2, SLC1A3, ALDH1L1, GFAP, AQP4, NDRG2), endothelial cell (FLT1, IGFBP7, SLC2A1), excitatory neuron (SYT1, RBFOX3, GRIN2A, SATB2, CUX1, CUX2), inhibitory neuron (GAD1, GAD2, LHX6, SST, VIP), microglia (P2RY12, CD74, DOCK8, GPR34, C1QB), oligodendrocyte (PLP1, MBP, UGT8, ST18, MOBP), and oligodendrocyte precursor cell (PDGFRA, PCDH15, MEGF11). Nuclei clusters enriched with a particular set of markers were considered to be of the corresponding cell type.
Removal of unwanted batch effects
In
order to reduce unwanted batch effects that originated from external
systematic or technical issues, we utilized Fast Mutual Nearest
Neighbors (fastMNN)92
correction. Here, we considered the three different injured marmosets
as the potential source of external batches, since the sample dissection
and library preparation were separately executed; there was also the
possibility that individual differences could be a contributor. Instead
of using fastMNN directly, we used the RunFastMNN function, which is efficiently integrated in the SeuratWrappers93 package, to unite this analysis to the whole pipeline. Additionally, the execution of the RunFastMNN function was based on some HVGs, which were identified separately but shared by the three batches, using Seurat FindVariableFeatures function with parameters selection.method = “vst”, nfeatures = 3000.
Astrocyte-specific analysis
Given
the goal was to compare astrocytes between injured and control cohorts,
the astrocyte nuclei cluster was isolated from each dataset using the Base Subset function89. The Base Merge function and Seurat FindIntegrationAnchors and IntegrateData functions with anchor.features = 3000, dims = 1:30 and doms = 1:30 parameters, respectively, were then used to combine the injured and control astrocyte clusters into one Seurat object. The Seurat FindVariableFeatures function was used with mean.function = ExpMean, dispersion.function LogVMR, nfeatures = 3000, selection.method = “vst” parameters prior to integration. The object was re-scaled via the Seurat ScaleData function and ran through PCA using the Seurat RunPCA function with default and npcs = 30 parameters, respectively, and the Seurat JackStraw and ScoreJackStraw functions with num.replicate = 100, dims = 30 and dims = 1:30 parameters, respectively, were used after merging and integration. Importantly, the top 30 PCs were used in the Seurat RunPCA function and significant PCs were used for subsequent dimensional reduction with Seurat RunUMAP using parameters reduction = “pca”, dims = 1:X, where X was the number of PCs with a p-value < 0.01 from the Seurat JackStrawPlot, for visualization.
Differential expression analyses of cells between injured and control cohorts was conducted using the Seurat FindMarkers function with logfc.threshold = -Inf, min.pct = -Inf parameters was adopted to identify differentially expressed genes (Supplementary Data 1).
For detecting top differentially expressed gene candidates, we defined
statistically significant as genes that had greater than 0.25
log-transformed fold change between groups in either direction and
exhibited adjusted p-values (False Discovery Rate) less than
0.01; further, only genes that were expressed by at least 10% of nuclei
in either population were considered. The generated data was then
visualized using the ggplot function94.
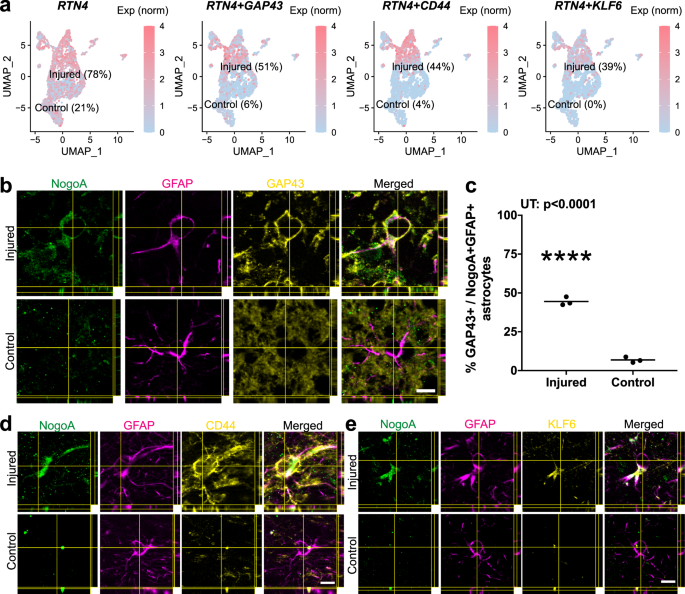
The top 30 upregulated differentially expressed genes (DEGs) were used for gene ontology (GO) enrichment analysis via PANTHER95 (Supplementary Data 1). More in depth analysis of the gene of interest, RTN4A (NogoA), was performed using HumanBase Functional Module Detection96. Briefly, the Seurat SubsetData function was used to isolate RTN4A- nuclei subset.name = “RTN4A”, low.threshold = 1 and RTN4A + nuclei subset.name = “RTN4A”, high.threshold = 1. DEGs for these subsets were identified using the FindMarkers function with logfc.threshold = 0.25, min.pct = 0.1, only.pos = T,
parameters. The top 100 upregulated DEGs from each subset were used for
the HumanBase Functional Module Detection (Supplementary Data 1).
Fresh and fixed marmoset tissue collection for protein analyses
At
the end of the designated post-stroke period: 1 DPI, 7 DPI, 14 DPI, or
21 DPI; marmosets were administered an overdose of pentobarbitone
(100 mg/kg; IM). For fresh tissue, brains were immediately harvested
following apnea. The occipital poles were dissected at the level of the
diencephalon and bisected coronally, with caudal portions encompassing
V1 and the ischemic zone and core, before snap freezing them in liquid
nitrogen.
For fixed tissue, animals were similarly euthanized and
transcardially perfused with 0.1 M heparinized saline solution (0.9%
sodium chloride at 37 °C containing 0.1 M heparin), followed by 4%
paraformaldehyde. Brains were collected, post-fixed for 24 h in 4%
paraformaldehyde, sucrose protected, and cryosectioned2,97.
Three days post-MCAO mouse tissue
C57Bl6/J mouse cortical tissue (n = 3)
was gifted from Professor Christopher G. Sobey. 8–12-week-old mice were
subjected to transient MCAO for 1 h and brains were collected 72 h
post-ischemia. Unperfused fresh brains were snap frozen over liquid
nitrogen and sectioned onto slides at 10 μm thick and 420 μm apart
before storing at −80 C. Sections were post-fixed in 4% PFA before
immunostaining as described in immunolabeling protocol below.
Experiments were approved by the Monash University Animal Ethics
Committee.
Human tissue
Snap-frozen and paraffin-fixed human brain samples (n = 1;
Age: 74 yrs; Gender: Female; COD: Cirrhosis; Post-mortem processing:
<24 h) were obtained from the Newcastle Brain Tissue Resource (UK)
with informed consent. Informed consent was provided by donors or their
nominated representatives under the understanding that donated brain
and/or spinal cord tissue will be used to make a diagnosis and for
ethically approved studies under the custodianship of the Newcastle
Brain Tissue Resource (UK). Consent can be withdrawn by the donors or
their nominated representative at any time before the donation without
reason. Consent can be withdrawn by nominated representatives at any
time after the donation without reason, which must result in the
immediate destruction of the donor samples in a lawful and respectful
manner. Procurement and use of human brain tissue were approved by the
Monash University Human Research Ethics Committee in compliance with
section 5.1.22 of the National Statement on Ethical Conduct in Human
Research (Ethics approval number: CF14/2120-2014001121).
Cell culture
Astrocytes
Astrocytes
were obtained from mouse, marmoset, and human. For mouse astrocytes,
magnetic isolation of ASCA-2+ astrocytes was performed. ASCA-2+
astrocytes were purified by immunopanning from seven P5 mouse pup
cortices. Briefly, cortices were dissociated mechanically (using a
scalpel blade) and enzymatically (using Papain: Worthington, LS003126)
with various triturations and Nitex (Sefar, 03-20/14) filtration steps
to generate a single-cell suspension. The cell suspension was
subsequently allowed to recover in DPBS (Life Technologies 14287080)
containing 0.2 mg/ml BSA and 0.004 mg/ml DNaseI at 37 °C for 30–45 min
in a 10% CO2 incubator. The cell suspension underwent debris
(Miltenyi, 130-109-398) and red blood cell (Miltenyi Cat. 130-094-183)
removal before incubation to positively select for astrocytes using
anti-ASCA-2 MicroBead Kit with FcR Blocking Reagent (Miltenyi,
130-097-679) and an MS column/ MACS separator. Isolated astrocytes were
cultured at 37 °C in a 10% CO2 tissue culture incubator in complete Astrocyte Growth Medium (AGM) as described in Liddelow, Guttenplan40.
The culture was maintained by replacing 50% of the medium every 7 days
with complete AGM containing fresh 5 ng/mL HB-EGF. Experiments were
approved by the Monash University Animal Ethics Committee.
For marmoset astrocytes, postnatal day 14 marmoset V1 was processed98.
Astrocytes were generated by passaging neurospheres three times to
maximize astrocyte yield, followed by 1-week in NeuroCult NSA with
differentiation supplement (StemCell Technologies) and further expanded
in Neurocult NSA with proliferation supplement (StemCell Technologies;
10 ng/ml rhFGF-2, 20 ng/ml rhEGF) and incubated at 37 °C, 5% CO2.
For
human astrocytes, a primary astrocyte cell line was obtained from
Lonza. Human astrocytes were maintained in AGM and treated in DMEM
serum-free conditions with IL-6 and IL-6 receptor for 24 h to induce a
more reactive phenotype.
Macrophages
Human
macrophages were derived from the THP-1 monocytic cell line (ATCC®
TIB202™) as per manufacture instructions. Human macrophages were
cultured in RPMI 1640 medium (ATCC® 302001™), supplemented with 0.05 mM
2mercaptoethanol and 10% fetal bovine serum (FBS) in antibiotic-free
conditions. THP-1 cells were then differentiated into macrophages with
0.1 µM 1α,25-dihydroxyvitamin D3 (vitamin D3; Sigma-Aldrich) or 200 nM
phorbol 12-myristate 13-acetate (PMA; Sigma-Aldrich) over 72 h38.
Cells were then treated with 200 ng/mL of recombinant rat NogoA
(1026-1090aa) and Fc Chimera protein (Nogo-66; R&D Systems), or with
human NogoA (566-748aa) and Fc chimera protein (Nogo-∆20; R&D
Systems), for 10 m, 30 m, 1 h, and 2 h.
Immunohistochemistry and immunofluorescence
For
immunohistochemistry (IHC), free-floating sections representing V1 were
treated with 0.3% hydrogen peroxide and 50% methanol in 0.01 M PBS for
30 m to inactivate endogenous peroxidases before pre-blocking. 15%
normal horse serum (NHS; Gibco, ThermoFisher, USA) in 0.01 M PBS, 0.3%
TritonX-100 (PBS-TX; Sigma-Aldrich) was used to pre-block tissue for IHC
and immunofluorescence (IF) before incubation with primary antibodies
(Supplementary Table 1)
overnight at 4 °C. For secondary labeling sections were incubated with
either biotinylated secondary antibodies or Alexa Fluor donkey anti-host
secondary antibodies for 1 h at room temperature. Following secondary
incubation, sections for IHC were treated with streptavidin-horseradish
peroxidase conjugate (GE Healthcare, Amersham, UK; 1:200) prior to
visualization using metal enhanced chromagen, 3,3'-diaminobenzidine
(DAB: Sigma-Aldrich). For IF staining, sections were treated with
Hoechst 333258 nuclei stain, mounted on Superfrost slides and treated
with 0.05% Sudan Black in 70% ethanol for 10 m before coverslipping
using fluoromount-G.
For human tissue, sections were dewaxed in
xylene before serial rehydration in ethanol. Antigen retrieval was
performed using 0.05% citraconic anhydride at 90 °C for 2 h. Sections
were subsequently blocked in 5% normal goat serum (NGS; Gibco,
ThermoFisher, USA), 1% bovine serum albumin (BSA; Sigma-Aldrich) and
0.1% fish skin gelatin (Sigma-Aldrich) in 0.01 M PBS, 2% TritonX-100
(PBS-TX; Sigma-Aldrich) for 1 h before incubation with primary
antibodies: rabbit anti-NogoA (1:200; Supplementary Table 1)
and mouse anti-GFAP (1:500; Sigma-Aldrich), for 72 h at 4 °C. Secondary
labeling was performed using goat anti-rabbit (Alexa Fluor 350;
ThermoFisher) and donkey anti-mouse (Alexa Fluor 647; ThermoFisher)
overnight at 4 °C before coverslipping using fluoromount-G.
For
cell culture staining, cells were fixed on poly-ornithine (1 mg/mL) and
laminin-coated (1 mg/mL) glass coverslips or chamber slides in 4% PFA
before blocking in 10% NHS in 0.01 M PBS, 0.3% PBS-TX. Cells were
incubated with primary antibodies (Supplementary Table 1)
for 2 h at room temperature before secondary labeling using Alexa Fluor
donkey anti-host secondary antibodies for 1 h at room temperature.
Cells were treated with Hoechst 333258 nuclei stain and coverslipped
using fluoromount-G.
Stained tissue/cells were analyzed using
either the Axioimager Z1 Upright Microscope and Axiovision Software
(Carl Zeiss), or the Sp5 Inverted Confocal Microscope, and LAS Software
(Leica Microsystems). ImageJ/ Fiji, Adobe Photoshop and Illustrator CC
2017 (Adobe) were used for image post-processing and figure design.
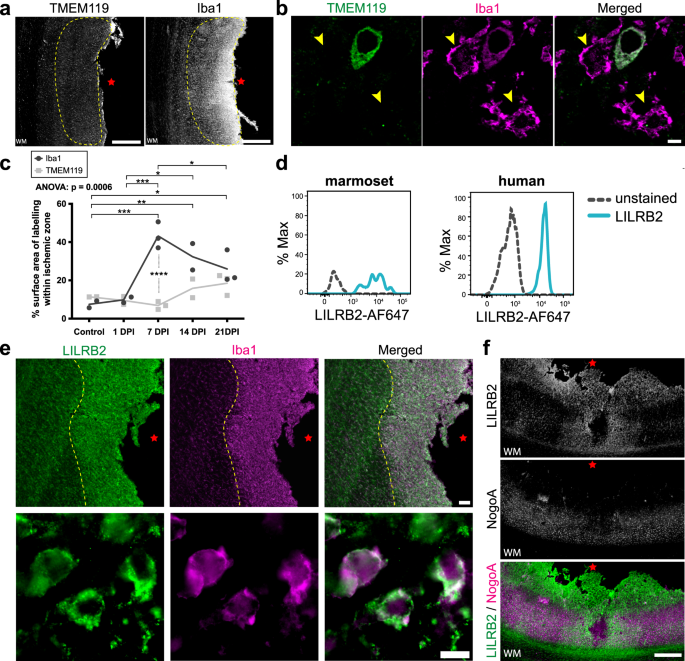
For Fig. 4f
the representative pseudo colored LILRB2 and NogoA photomicrographs
were obtained by DAB immunohistochemistry and overlaid using Adobe
Photoshop in order to show spatial distribution of labeling. Please note
that these photomicrographs are from different (adjacent) sections and
have been overlaid to create a representative image as double labeling
with LILRB2 and NogoA was not possible at the time due to available
antibodies.
Protein extraction, SDS-PAGE, and immunoblot
Snap-frozen
V1 tissues were homogenized in either TRIzol LS Reagent (ThermoFisher),
or NP40 (ThermoFisher) lysis buffer, and protein extracted according to
manufacturer’s instructions. Subsequent lysates were supplemented with
10% Protease Inhibitor Cocktail (PrIC; Sigma-Aldrich), 1% Phosphatase
Inhibitor Cocktail 2 (PhIC; Sigma-Aldrich), 1 mM PMSF Serine Protease
Inhibitor (Sigma-Aldrich). Protein concentration was determined using
Bradford Reagent (Sigma-Aldrich). At experimental endpoints, cells were
lysed using RIPA buffer (ThermoFisher) and addition of previously
mentioned inhibitor cocktails. Marmoset and human frontal cortical
tissues were also lysed in this way for use as positive controls. Equal
concentrations of samples were added to 4X Loading Buffer (240 nM TRIS,
8% SDS, 40% glycerol, 20% 2-mercaptoethanol, 0.05% bromophenol blue),
heated at 95 °C for 10 min, and electrophoretically separated on a 4–12%
Bis-Tris gel (ThermoFisher). Following gel electrophoresis, proteins
were blotted onto PVDF membranes (ThermoFisher), pre-blocked in Odyssey
Blocking Buffer (PBS; Li-Cor) before incubation with primary antibodies
(Supplementary Table 1)
overnight at 4 °C. Following washes, membranes were incubated with
IRDYE secondary antibodies (Li-Cor) and visualized using the Odyssey CLx
Scanner (Li-Cor).
Densitometry
Densitometric
analysis was performed on scanned immunoblots using Image Studio Lite
(Li-Cor: version 5.2.5), and values representing protein over loading
control were calculated. Data distribution was evaluated for Gaussian
distribution using the Shapiro–Wilk normality test. Ordinary one
way-ANOVA with Dunnett’s multiple comparisons post-hoc test were used
for statistical analysis of densitometry data—Prism 7 (GraphPad).
ImageJ/ Fiji (Rasband) and Adobe Illustrator CC 2017 (Adobe) were used
for post-processing of immunoblot images and figure design.
Antibody characterization
NogoA and LILRB2 antibodies (Supplementary Table 1)
were tested in rat, marmoset and human cortical tissue to ensure
uniformity of detectable bands across species (Supplementary Fig. 6a).
NogoA antibody specificity was validated using two antibodies
recognizing separate epitopes on the NogoA ligand due to the ambiguity
of some of the data surrounding NogoA expression in various CNS injury
models. The NogoA antibodies were tested on fresh and fixed marmoset
cortical tissue, rat cortical tissue as a positive control and marmoset
liver as a negative control, with and without pre-incubation with
blocking peptides to determine antibody specificity (Supplementary Fig. 6b, c). TMEM119 and LILRB2 antibodies (Supplementary Table 1)
were tested in fixed marmoset spleen and brain tissue with an Iba1
co-label to ensure specificity of TMEM119 to microglia in marmoset
(Supplementary Fig. 6d).
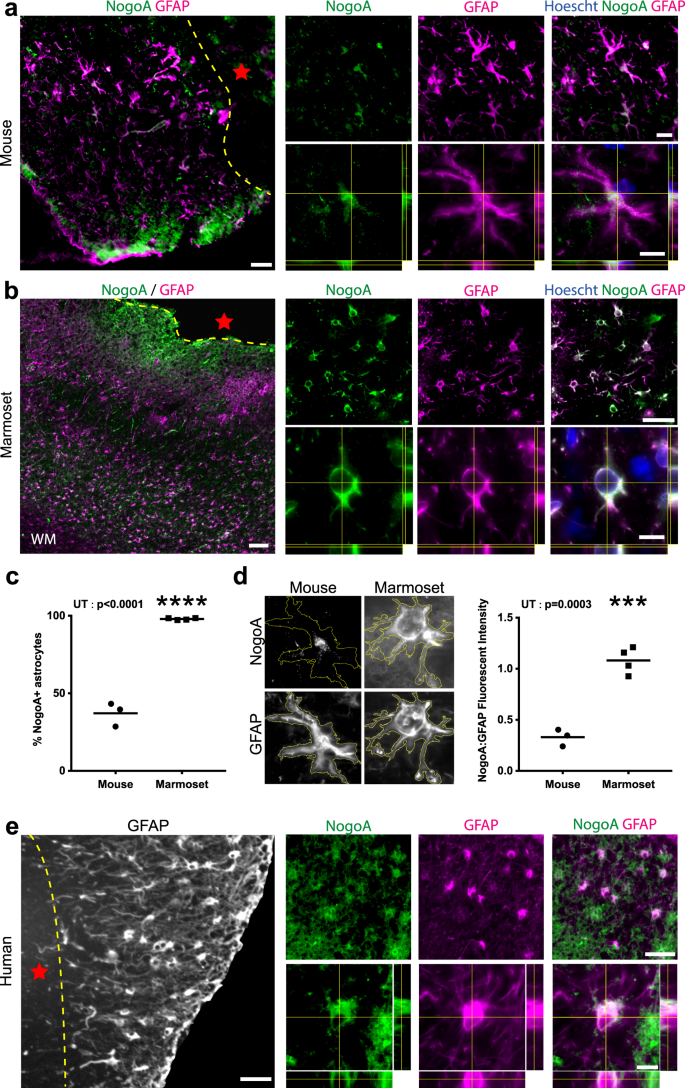
NogoA+/GFAP+ cell quantification
Z
stack images were taken at high magnification of randomly selected
GFAP+ cells within 500 µm of the ischemic core in 3 days post-MCAO mouse
tissue (n = 3) and in 7 days post-ischemia marmoset tissue (n = 4).
Colocalization of NogoA and GFAP or lack thereof was determined using
ImageJ/Fiji and subsequently quantified as the number of NogoA+
astrocytes over the total number of counted astrocytes (GFAP+ cells) and
expressed as a percentage. A minimum of 30 cells per animal, over 3–5
sections across three mice and four marmosets, were imaged and counted.
These images were also used to determine the fluorescent intensity of
NogoA expression by GFAP+ astrocytes. Ten cells were randomly selected
from each of the three mice and four marmosets, and the mean fluorescent
intensity of NogoA was calculated over the mean fluorescent intensity
of GFAP using ImageJ/ Fiji and expressed as a ratio of NogoA: GFAP. Data
distribution for both cell counts and fluorescent intensity were
evaluated for Gaussian distribution using the Shapiro–Wilk normality
test. Unpaired t-tests were used for statistical analysis of data using
Prism 7 (GraphPad).
Iba1/TMEM119 quantification
Iba1 and TMEM119 DAB-immunolabeled marmoset V1 tissues across control (n = 2), 1 (n = 2), 7 (n = 3), 14 (n = 2) and 21 (n = 3)
DPI time points were imaged and photo-merged using Adobe Photoshop. The
area of Iba1 and TMEM119 immunolabeling was quantified over three
sections from each animal using ImageJ. Data distribution was evaluated
for Gaussian distribution using the Shapiro–Wilk normality test.
Ordinary two way-ANOVA and Sidak’s multiple comparisons post-hoc test
were used for statistical analysis of data using Prism 7 (GraphPad). For
tabulated statistics see the Source Data File.
Marmoset and human blood-derived macrophages for flow cytometry
Isolation of marmoset blood mononuclear cells
Marmoset
blood was collected by cardiac puncture using syringes pre-coated with
sodium citrate solution (3.8% w/v) and expelled into citrate coated
collection tubes (~10% v/v of citrate solution: blood volume).
Mononuclear cells were collected by density centrifugation using
lymphocyte separation media (1.077 g/mL, Lonza)99. Red blood cells were removed by lysis using NH4Cl lysis buffer, the MNC washed twice with PBS (0.5% BSA), filtered through a 40 µm strainer and counted.
Isolation of human blood mononuclear cells
Human
blood was obtained from healthy donors (Australian Red Cross Blood
Service, Melbourne) in citrate coated bags. Low density mononuclear
cells (MNC) were isolated by discontinuous density centrifugation using
Ficoll-Hypaque (1.077 g/mL, Pharmacia Biotech). Red blood cells were
removed by lysis using NH4Cl lysis buffer, the MNC washed
twice with PBS (0.5% BSA), filtered through a 40 µm strainer and counted
using a CELL-DYN Emerald hematology analyzer (Abbott). All experiments
were undertaken following informed consent from donors and approval from
the Monash human ethics committee.
Autologous marmoset and human serum
To
harvest autologous serum, freshly harvested non-fractionated marmoset
or human blood was centrifuged at 400 × g and plasma collected. The
remaining red/white blood cell layer was processed for MNC the next day
as described above. The collected plasma was calcified with 20% (w/v)
CaCl2 solution in H2O at a ratio of 1:100 and 1:20 v/v CaCl2
solution: plasma for human and marmoset plasma, respectively. The
mixture was left undisturbed overnight at 4 °C, centrifuged at 2000 × g
to remove fibrinogen clots and the serum collected and stored in
aliquots at −20 °C.
In vitro culture of monocyte-derived macrophages
Marmoset or human MNC were resuspended in DMEM (0.5% BSA) at a density of 3 × 10⁶ cells/mL and seeded into 12 or 24-well tissue culture plates. The cells were incubated in a CO2
incubator at 37 °C for 1 h prior to non-adherent cells being removed by
aspiration, leaving behind adherent monocytes. Fresh DMEM (supplemented
with 10% autologous serum and Gibco GlutaMAX) was added and the
adherent cells cultured for 5 days (human) or 7 days (marmoset) with
autologous serum/media being replaced on day 3 and 5. The plates were
gently washed with warm PBS, the adherent macrophages lifted with trypLE
Express (Gibco) cell dissociation enzyme and washed with PBS (0.5% BSA)
for subsequent analysis.
Flow cytometry
For
analysis of LILRB2 expression on marmoset and human monocyte-derived
macrophages were first blocked with human TruStain FcX Fc blocking
solution (Biolegend), then labeled with and without anti-human LILRB2
(5 µg/mL; R&D Systems). The cells were washed with PBS (0.5% BSA)
and then labeled with goat anti-mouse IgG2a-AF647 (2 µg/mL) secondary
antibody. Finally, the cells were washed and labeled with a cocktail
containing anti-human CD11b-PE (clone D12; BD Biosciences) and
anti-human CD14-PECy7 (clone M5E2; BD Biosciences), washed, resuspended
in PBS (0.5% BSA plus propidium iodide) and analyzed on an LSR II (BD
Biosciences)100.
Flow cytometric analysis was performed using FlowJo X software. The
expression of LILRB2 was assessed on macrophages, which were identified
as CD14 +/CD11b+ cells that had been pre-gated on single (FSC-H vs
FSC-A), nucleated (SSC-A vs FSC-A), viable (PIneg) cells. For gating strategy, see Supplementary Fig. 7.
Stripe (attraction/repulsion) assay
Thirteen
millimetre diameter glass coverslips were cleaned overnight in 2 M HCl
at 60 °C followed by sonication in graded alcohols. Coverslips were then
coated overnight with Poly-L-Ornithine (1 mg/mL) at 37 °C. Coverslips
were dried and placed coated-side down on a silicon matrix with 50 µm
wide, 50 µm apart alternating grooves (obtained from Dr. Martin
Bastmeyer, Karlsruhe University, Germany). Nogo-66 (10 µg/mL), Nogo-∆20
(10 µg/mL), or recombinant human fc (10 µg/mL) were injected into the
constructs and incubated for 1.5 h at room temperature in order to
create the stripes. PBS was injected to flush and wash out unbound Fc
proteins and the coverslips removed from the matrix and placed face-up
in a 24-well plate. Coverslips were subsequently washed in PBS followed
by laminin (1 mg/mL in MEM) for 2 h at 37 °C. Human THP-1 macrophages
were either untreated or treated with LILRB2 blocker antibody (10 µg/mL)
for 30 m at room temp in 10% serum-rich RPMI with growth media
supplements. After incubation cells were spun down and resuspended in
serum-free RPMI with growth media supplements prior to loading.
Coverslips were rinsed in MEM and appropriately conditioned macrophages
were plated on each coverslip to create three different experimental
conditions: control-fc stripes with human macrophages, Nogo-66 or
Nogo-∆20 stripes with human macrophages and Nogo-66 or Nogo-∆20 stripes
with LILRB2 blocker-treated human macrophages. The cultures were stopped
with 4% PFA after at least 16 h. Stripes and macrophages were
visualized using goat anti-Fc and rabbit anti-Iba1 and appropriate
secondary antibodies, respectively. NogoA-repelled Iba1+ macrophages
were counted when at least 50% of the cell body was located in the space
between stripes. Receptor specificity of the NogoA-dependent
cell-repulsion was confirmed through LILRB2 receptor blockade using a
monoclonal blocking antibody. Data distribution was evaluated for
Gaussian distribution using the Shapiro–Wilk normality test. Ordinary
one way-ANOVA with post-hoc Tukey’s multiple comparisons tests were used
for statistical analysis of cell count data using Prism 7 (GraphPad).
For tabulated statistics see the Source Data File.
Quantification and statistical analysis
Statistical details for each experiment, including n
numbers and the statistical test performed, and data presentation can
be found in the corresponding figure legend, above in the experimental
methods, or the Source Data File. Statistical analysis was performed
using Prism 7 (GraphPad) software.
Reporting summary
Further information on research design is available in the Nature Research Reporting Summary linked to this article.