Use the labels in the right column to find what you want. Or you can go thru them one by one, there are only 33,020 posts. Searching is done in the search box in upper left corner. I blog on anything to do with stroke. DO NOT DO ANYTHING SUGGESTED HERE AS I AM NOT MEDICALLY TRAINED, YOUR DOCTOR IS, LISTEN TO THEM. BUT I BET THEY DON'T KNOW HOW TO GET YOU 100% RECOVERED. I DON'T EITHER BUT HAVE PLENTY OF QUESTIONS FOR YOUR DOCTOR TO ANSWER.
Changing stroke rehab and research worldwide now.Time is Brain!trillions and trillions of neuronsthatDIEeach day because there areNOeffective hyperacute therapies besides tPA(only 12% effective). I have 523 posts on hyperacute therapy, enough for researchers to spend decades proving them out. These are my personal ideas and blog on stroke rehabilitation and stroke research. Do not attempt any of these without checking with your medical provider. Unless you join me in agitating, when you need these therapies they won't be there.
What this blog is for:
My blog is not to help survivors recover, it is to have the 10 million yearly stroke survivors light fires underneath their doctors, stroke hospitals and stroke researchers to get stroke solved. 100% recovery. The stroke medical world is completely failing at that goal, they don't even have it as a goal. Shortly after getting out of the hospital and getting NO information on the process or protocols of stroke rehabilitation and recovery I started searching on the internet and found that no other survivor received useful information. This is an attempt to cover all stroke rehabilitation information that should be readily available to survivors so they can talk with informed knowledge to their medical staff. It lays out what needs to be done to get stroke survivors closer to 100% recovery. It's quite disgusting that this information is not available from every stroke association and doctors group.
Every single stroke hospital should have videos of musicians playing their instruments. If your stroke hospital doesn't have this or know about it they are completely incompetent.
Tonight I watched this live, but since there is NO place to get action observation video I can't focus on individual fingers like I should be able to. Someday I'll be able to play my sax again, probably never like this but there is always hope.
Fuck proportional recovery and the failure it represents. Have you EVER talked to any stroke survivor that accepted proportional recovery without them being brain-washed into accepting your tyranny of low expectations? I would fire you on the spot for this crapola. 100% RECOVERY IS THE ONLY GOAL IN STROKE.
Prediction
of who will recover after stroke has been a perennial focus for both
researchers and clinicians in the field of neurorehabilitation. The
prospects of applying a population-based model to predict outcome in
individual patients might ultimately allow more focused approaches to
stroke rehabilitation and foster a better distribution of precious
health care resources. Aside from anatomical biomarkers, such as the
integrity of the corticospinal tract, recent attention has focused on
the proportional recovery rule, formally proposed in this journal more
than 10 years ago by Prabhakaran et al,1
who described a surprisingly linear relationship between Fugl-Meyer
Assessment upper extremity scores obtained within 3 days after stroke
and those obtained at 3 months poststroke, illustrating the general
principle of spontaneous recovery with a level of predictability not
previously appreciated.(The fact that you accept this relationship as normal and expected is what is so fucking bad about this. You expect the status quo to stay the same. For that reason alone you need to be fired.) This relationship appears to hold for most
individuals (so-called “fitters” or “recoverers”), but a subset of
individuals (so-called “non-fitters” or “non-recoverers”) fall off the
linear regression line. First applied to upper limb motor impairment,
the proportional recovery rule has been examined in a variety of motor
and nonmotor impairments, and results have generally been in agreement
with the initial linear relationship. Recent controversy surrounding the
proportional recovery rule has been based on statistical factors such
as mathematical coupling and nonlinearity of outcome scales, questioning
not only the accuracy but also the underlying validity of this
predictive population-based model. Two articles in the current issue of Neurorehabilitation and Neural Repair
highlight some of the emerging views and suggestions for future
research regarding this model. The first article by Senesh and
Reinkensmeyer examines the reasons why “non-fitters” do not recover
according to the proportional recovery algorithm. They argue that the
local slope of the linear regression reflects the difficulty of test
item scores related to arm and hand movement at follow-up, consistent
with the view that non-fitters lack sufficient corticospinal tract. They
suggest that at least some non-fitters may have a heightened response
to intensive movement training and should be targeted early after stroke
for such rehabilitative training. In the second article by Kundert et
al, the statistical validity of the proportional recovery rule is
examined in the context of recent criticisms regarding its underlying
assumptions. Despite 2 recent articles critical of statistical
relationships of baseline impairment scores to follow-up scores,
especially when used for patient-level predictions, Kundert et al
contend that the systematic non-artifactual relationship between initial
impairment and motor recovery provides a valid statistical and
biologically meaningful model, and that future studies of proportional
recovery should use more sophisticated analysis techniques and rigorous
methods to assess validity, including comparisons to alternative models.
Randolph J. Nudo, PhD Editor-in-Chief
Reference
1.
Prabhakaran, S, Zarahn, E, Riley, C, et al. Inter-individual variability in the capacity for motor recovery after ischemic stroke. Neurorehabil Neural Repair. 2008;22:64-71. doi:10.1177/1545968307305302 Google Scholar | SAGE Journals | ISI
If your stroke medical professionals are not on the bus to 100% recovery, shove them off the bus. THE ONLY GOAL IN STROKE IS 100% RECOVERY, anyone not ok with that needs to get out of stroke.
One approach, which is tempting in the short run, is to wait until
people are on the bus and then ask each person where they want to go.
Seek to build consensus. Try not to leave anyone out.
The other approach, which works far better if you have a fleet of
available buses, is to announce in advance where the bus is going. That
way, anyone who wants to go where you’re headed can get onboard.
Enrollment is critical. Enrollment allows leaders to lead. Not by
endlessly querying those that they seek to serve, but by announcing
their destination and then heading there, with all deliberate speed
Ask your doctor how you can be an optimist when s/he has nothing to get you to 100% recovery. And using the tyranny of low expectations is not valid. Survivors do not set small goals, they want 100% recovery.
WHAT THE FUCK IS YOUR DOCTOR DOING TO GET YOU THERE?
The study in Proceedings of the National Academy of Sciences
found that people who had higher levels of optimism had a longer life
span. They also had a greater chance of living past age 85. The
researchers analyzed data gleaned from two large population studies:
about 70,000 women from the Nurses’ Health Study and about 1,400 men
from the Veterans Affairs Normative Aging Study.
The Nurses’ Health Study used items from the Life Orientation Test
to assess optimism. The measure asks respondents to rate their level of
agreement to several statements about optimism. The Normative Aging
Study relied on the Optimism-Pessimism Scale,
administered as part of a personality assessment. This scale examines
the positive and negative explanations people give for events in their
life.
For both men and women, higher levels of optimism were associated
with a longer life span and “exceptional longevity,” which the
researchers defined as surviving to 85. The study controlled for factors
like chronic physical conditions (such as hypertension or high
cholesterol) and health behaviors (such as smoking or alcohol use).
There were several limitations to the study results. For example,
participants were largely white and had higher socioeconomic status than
the general population. These factors may limit whether the findings
apply to a wide range of people.
So why might optimism affect longevity? The study wasn’t designed to
explain this, but the researchers had several thoughts. While one
component of optimism appears to be heritable — that is, tied to our
genes — our environment and learning also shape a significant portion.
One takeaway is that we can all learn ways to be more optimistic.
How can you become more optimistic?
Whether you’re naturally optimistic or not, you can take certain steps in that direction.
Reframe situations. When some people confront
difficulties, they tend to only view the negative aspects of the
situation. Also, they consider these aspects unchangeable. To reframe a
difficult situation, search for any positive aspects or silver linings.
Is there anything you can learn from the situation? Is there anything
you can teach to others about the situation, after you resolve it?
Set goals. Set achievable goals for each day and
adjust those goals as needed. Be specific and realistic. For example,
rather than a broad goal, such as “clean house,” identify specific areas
that you plan on cleaning (wipe down counters, scrub kitchen sink).
Research suggests that setting goals and having the confidence to
achieve these goals is related to optimism.
Set aside time to focus on the positive. At a set
time each day (perhaps at bedtime), think about the positive aspects of
your day. What went well? What are you happy about? What are you proud
of?
Practice gratitude meditations. Gratitude
meditations focus on giving thanks for the positive aspects of your
life, which can include family members, friends, or possessions, among
other things. You can find numerous scripts and guided meditations
available online.
Strengthen social relationships. The researchers
noted that optimism is related to strong social networks. A strong
social network can include spending time with close friends, or
participating in regularly scheduled group or community activities.
Joining new groups or scheduling time to see friends and family and
engage in activities strengthens these relationships. Focus on spending
time with positive and supportive people.
Practice the half-smile. A psychotherapy technique
to cope with sad feelings is to practice smiling for a few minutes each
day. If a full smile is not possible, a half-smile works as well. Notice
any impact on your thoughts, mood, and level of optimism.
FreeSurfer/Subfields and fsl/FIRST segmentations agreed best with manual tracing
Abstract
We
assessed first-year hippocampal atrophy in stroke patients and healthy
controls using manual and automated segmentations: AdaBoost, FIRST
(fsl/v5.0.8), FreeSurfer/v5.3 and v6.0, and Subfields (in
FreeSurfer/v6.0). We estimated hippocampal volumes in 39 healthy
controls and 124 stroke participants at three months, and 38 controls
and 113 stroke participants at one year. We used intra-class
correlation, concordance, and reduced major axis regression to assess
agreement between automated and ‘Manual’ estimations. A linear
mixed-effect model was used to characterize hippocampal atrophy.
Overall,
hippocampal volumes were reduced by 3.9% in first-ever stroke and 9.2%
in recurrent stroke at three months post-stroke, with comparable
ipsi-and contra-lesional reductions in first-ever stroke. Mean atrophy
rates between time points were 0.5% for controls and 1.0% for stroke
patients (0.6% contra-lesionally, 1.4% ipsi-lesionally). Atrophy rates
in left and right-hemisphere strokes were comparable. All methods
revealed significant volume change in first-ever and ipsi-lesional
stroke (p < 0.001).
Hippocampal volume estimation
was not impacted by hemisphere, study group, or scan time point, but
rather, by the interaction between the automated segmentation method and
hippocampal size. Compared to Manual, Subfields and FIRST recorded the
lowest bias. FreeSurfer/v5.3 overestimated volumes the most for large
hippocampi, while FIRST was the most accurate in estimating small
volumes. AdaBoost performance was average.
Our
findings suggest that first-year ipsi-lesional hippocampal atrophy rate
especially in first-ever stroke, is greater than atrophy rates in
healthy controls and contra-lesional stroke. Subfields and FIRST can
complementarily be effective in characterizing the hippocampal atrophy
in healthy and stroke cohorts.
Keywords
Hippocampal atrophy
FreeSurfer
Linear mixed-effect model
Magnetic resonance imaging
Stroke
1. Introduction
Stroke is a major global cause of disability and death (Strong, Mathers et al. 2007, Maier, Schroder et al. 2015, Aerts, Fias et al. 2016). People with stroke have a higher incidence of dementia (Makin, Turpin et al. 2013),
and up to one-third of stroke survivors develop post-stroke dementia
(PSD) in the years following the initial stroke incident (Mok, Lam et al. 2017).
Understanding the trajectory of cognitive decline and associated brain
changes over the first year after stroke is crucial for developing
treatments to delay the onset of PSD and modify its course.
The
segmentation of structures characterized by morphological complexity –
like the hippocampi – is challenging. Despite serious efforts to
automate hippocampal segmentation, this is still commonly performed by
human experts (Maglietta, Amoroso et al. 2016).
However, manual segmentation is restricted by time and is costly for
large datasets, has lower reproducibility unless protocols are strictly
adhered to, and its results may be influenced by rater bias (Colon-Perez, Triplett et al. 2016).
The high reproducibility of automated methods reduces bias and
facilitates the replication of findings between studies, in addition to
allowing for faster processing. However, most longitudinal validation
studies of automated segmentation have focused on healthy (Morey, Petty et al. 2009, Perlaki, Horvath et al. 2017) and Alzheimer's disease (AD) cohorts (Morra, Tu et al. 2010, Mulder, de Jong et al. 2014, Cover, van Schijndel et al. 2016, Maglietta, Amoroso et al. 2016, Cover, van Schijndel et al. 2018). Automated segmentation has not been validated for the characterization of hippocampal atrophy in stroke.
Assessing
longitudinal brain atrophy in conditions with destructive brain
lesions, such as stroke, can be particularly challenging given the
dynamic structural alterations before and after the stroke. The timing
and sample size of MRI datasets pose challenges to conclusions about
structural atrophy. There is also the challenge posed by the inclusion
of patients with recurrent (i.e., prior) stroke who may already have
suffered significant regional brain atrophy including in the
hippocampus. While we have looked at brain atrophy in the first three
months post-onset (Brodtmann, Pardoe et al. 2012, Brodtmann, Pardoe et al. 2013, Li, Pardoe et al. 2015),
relatively longer term trajectories of hippocampal volume changes have
not been examined. Given that most functional recovery occurs in the
first three months after stroke (Lee, Lim et al. 2015), the three-month time point may serve as a better baseline for assessing longitudinal brain atrophy.
Researchers have examined whole-brain (Seghier, Ramsden et al. 2014) and hippocampal (Schaapsmeerders, Tuladhar et al. 2015)
atrophy in young and old patients many years after stroke. They
reported lower volumes ipsi-lesionally in the whole-brain and in the
hippocampus. However, the profile and rates of hippocampal atrophy over
the first year remain largely unknown.
Previously (Khlif, Egorova et al. 2018),
we assessed the agreement between a number of automated segmentation
methods and manual tracing in estimating hippocampal volumes in healthy
participants and stroke patients at three months post-stroke. The top
performers (AdaBoost, FIRST, and Subfields) in that study, in addition
to FreeSurfer/v5.3 and v6.0, were used in the current study. The latter
two methods were included in order to validate the improvement in
hippocampal volume estimation sought with the evolution of FreeSurfer
algorithms. We expected the algorithms’ performance at 12 months to be
consistent with their previous performance at three months. Moreover, we
needed to evaluate their performance in assessing hippocampal atrophy
between three and 12 months to better inform future studies.
Accordingly, our aims were to:
1
Quantify
hippocampal volume change in healthy and ischemic stroke participants
in the period between three and 12 months after stroke (based on volumes
estimated using manual and automated segmentation methods).
2
Quantify
hippocampal volume change in left-hemisphere stroke compared to
right-hemisphere stroke, in first-ever stroke compared to recurrent
stroke, and in ipsi-lesional hippocampus compared to contra-lesional
hippocampus.
3
Evaluate
the agreement between manual tracing and automated segmentation in
estimating hippocampal volumes at 12 months post-stroke.
4
Assess
the sensitivity of automated algorithms in detecting longitudinal
hippocampal volume change between three and 12 months post-stroke.
You're missing the whole fucking point. WHAT NEEDS TO BE DONE TO PREVENT VASCULAR DEMENTIA POST STROKE? This shows extreme laziness and NO STROKE LEADERSHIP. I would have all these stroke 'experts' fired. Once again describing a problem but offering NO useful solution.
DUBAI, United Arab Emirates, Oct. 25, 2019 /PRNewswire/ --What
if by reducing your risk for stroke, you could also reduce the risk of
dementia? Breakthrough research suggests that there is a connection.
During the XXIV World Congress of Neurology
(WCN 2019), join a panel of the world's leading experts on stroke as
they discuss this breakthrough research during a live press conference.
The press conference will take place at the World Trade Centre in Dubai and will be live-streamed via the World Federation of Neurology Facebook Page (www.facebook.com/wfneurology) on Monday, Oct. 28, 2019, at 3:15 pm. GST.
WCN 2019: Accelerating the Pace of Change
Global incidence of stroke is increasing at alarming
rates, with new risk factors such as climate change and air pollution
coming to the forefront. As the global burden of stroke becomes more
evident, especially in developing countries, the need for a consistent
approach to stroke prevention is more evident than ever.
The elite panel of experts will discuss breaking news in stroke and vascular dementia, including the following key insights:
Groundbreaking research revealing that measures of stroke prevention may also work to reduce the risk of dementia
Climate change, air pollution and other new risk factors for stroke
Challenges of managing stroke and dementia in Africa and developing countries
New designation of stroke by the World Health Organization(This occurred 13 years ago, keep up with the program. Incompetence in full display. )
All over the world, incidents of dementia are increasing at alarming rates
PRESS CONFERENCE PARTICIPANTS
Prof. William Carroll, MB, BS, MD, President of World Federation of Neurology
Prof. Michael Brainin MD PhD Dr (hons) FESO FAHA FEAN FWSO, President, World Stroke Organisation
Prof. Adesola Ogunniyi, MD
Prof. Najeeb Qadi, MD
Prof. Vladimir Hachinski, MD
Media are invited to join the WCN 2019 Live Stream at www.facebook.com/wfneurology,
and can attend the World Congress of Neurology in person by obtaining
complimentary passes upon arrival at the World Trade Centre Dubai. About the World Federation of NeurologyThe
World Federation of Neurology represents 120 member neurological
societies around the globe whose mission is to foster quality neurology
and brain health worldwide by promoting neurological education and
training with an emphasis on under-resourced areas of the world. The WFN
supports the spread of accurate research and clinical information in
the pursuit of improvements in the field of neurology. With support from
member organizations, the WFN unifies the world to give patients better
access to brain health.
For more information, please visit www.wfneurology.org. Review all WCN 2019 News on our Virtual Press Office at http://wfneurology.vporoom.com/about. Like us on Facebook at https://www.facebook.com/wfneurology/, and follow us on Twitter at https://twitter.com/wfneurology or by searching using the tag #WCN2019. Media Contact Yakkety Yak Contact: Ashley Logan Yakkety Yak LLC press@yakketyyak.com
SOURCE World Federation of Neurology
Body
weight support (BWS) systems on treadmill have been proposed as a
strategy for gait training of subjects with stroke. Considering that
ground level is the most common locomotion surface and that there is
little information about individuals with stroke walking with BWS on
ground level, it is important to investigate the use of BWS on ground
level in these individuals as a possible alternative strategy for gait
training.
Methods
Thirteen
individuals with chronic stroke (four women and nine men; mean age
54.46 years) were videotaped walking on ground level in three
experimental conditions: with no harness, with harness bearing full body
weight, and with harness bearing 30% of full body weight. Measurements
were recorded for mean walking speed, cadence, stride length, stride
speed, durations of initial and terminal double stance, single limb
support, swing period, and range of motion of ankle, knee, and hip
joints; and foot, shank, thigh, and trunk segments.
Results
The
use of BWS system leads to changes in stride length and speed, but not
in stance and swing period duration. Only the hip joint was influenced
by the BWS system in the 30% BWS condition. Shank and thigh segments
presented less range of motion in the 30% BWS condition than in the
other conditions, and the trunk was held straighter in the 30% BWS
condition than in the other conditions.
Conclusion
Individuals
with stroke using BWS system on ground level walked slower and with
shorter stride length than with no harness. BWS also led to reduction of
hip, shank, and thigh range of motion. However, this system did not
change walking temporal organization and body side asymmetry of
individuals with stroke. On the other hand, the BWS system enabled
individuals with chronic stroke to walk safely and without physical
assistance. In interventions, the physical therapist can watch and
correct gait pattern in patients' performance without the need to
provide physical assistance.
Background
Mobility reestablishment is one of the main goals of a rehabilitation program for individuals with stroke [1–3].
Among the different strategies of gait training for these individuals,
the use of treadmill with partial body weight support (BWS) has been a
very popular one [4, 5].
The theoretical background of this strategy originated from treadmill
gait training in animals with a complete spinal cord injury [6, 7]
which established that the treadmill promotes an automatic locomotor
pattern, generated by spinal neurons, named the central pattern
generator [8–10].
Usually,
the BWS system consists of a treadmill and a mounting frame with an
apparatus in which the patient is mechanically supported by a harness
while walking on a treadmill [11]. The BWS system unloads body weight symmetrically from the lower limbs as they move forward [5, 12], improves balance control, and avoids falls [9].
Among
the possible percentages of body weight unloading allowed by BWS
systems, most studies have adopted 30% BWS because of its effectiveness
on gait training [13–15].
In addition to the appropriate percentage of body weight unloading
employed during gait training with BWS, it would be reasonable to
evaluate the surface the patient walks on during the intervention as
specifically as possible in order to facilitate skill transfer to daily
life activities [10, 16]. For example, the requirements for walking on treadmill differ in terms of propulsion and balance control [17]
from the requirements for walking overground. In addition, the speed
adopted to walk on treadmill is not self-selected as when walking
overground [12, 18–21].
The differences between walking on treadmill and overground have been examined in healthy adults [18, 21–23] and individuals with stroke [12, 19].
The different requirements of treadmill and overground walking
influence gait characteristics such as joint angles, temporal-spatial
parameters [18, 24, 25], foot contact [20], and muscle activation [12].
Similarly, these differences may also influence the ways these
improvements from walking training on the treadmill are transferred to
overground walking [10, 21, 25]. To our knowledge, only a few studies have been conducted to examine the use of BWS on ground level [15, 26],
and these investigations were limited to a few aspects of walking
itself. Considering that ground level is the most common locomotion
surface and that there is little information about individuals with
stroke walking with BWS on ground level, it is important to investigate
the use of BWS on ground level in these individuals as a possible
alternative strategy for gait training. Therefore, the purpose of this
study was to investigate individuals with chronic stroke, walking
overground with BWS. More specifically, we analyzed the spatial-temporal
parameters and patterns and range of motion of joint and segmental
angles during ground level walking at self-selected and comfortable
speeds, with and without the use of BWS, for individuals with chronic
stroke. We suggest that individuals with stroke walking with BWS on
ground level would show a more stable and symmetrical walking pattern.
Methods
Participants
Twenty-five
individuals with chronic stroke from a waiting list for the university
physical therapy clinic were contacted by phone and invited to take part
in the study. Seventeen of these individuals agreed to be evaluated in
the laboratory. After the initial evaluation, which consisted of
personal data registration and physical examination (evaluation of the
level of spasticity and functional gait capacity), thirteen individuals
(four women and nine men), mean age, 54.46 (± 8.58) years and at
intervals longer than one year since last stroke, were eligible to
participate in the study. Six individuals had right-side and seven had
left-side hemiparesis of either ischemic (n = 11) or hemorrhagic (n = 2)
origin.
Inclusion criteria were: elapsed time since stroke longer
than one year; ability to walk approximately 10 m with or without
assistance; and spasticity classified under level 3 by the Modified
Ashworth Scale (for more detail, see Lindquist et al. [13]).
Participants were excluded if they did not present spasticity (n = 1)
or did present clinical signs of heart failure (New York Heart
Association), arrhythmia, or angina pectoris; orthopedic (n = 2) or
other neurological diseases (n = 1) that compromised gait; or severe
cognitive or communication impairments. The University ethics committee
approved this study and all individuals signed an informed consent
agreement.
Task and procedures
Participants
were assessed walking at a self-selected comfortable speed along a 10 m
walkway in three different conditions: walking freely with or without
assistance ("no harness" condition); walking with harness and full body
weight bearing ("0% BWS" condition); and walking with harness and 30% of
full body weight unloaded ("30% BWS" condition). Before the evaluation
in each condition, all participants practiced for a few trials until
they felt comfortable with the experimental conditions. Then, six trials
in each condition were videotaped by four digital cameras (Panasonic,
AG-DVC7P) at 60 Hz that were positioned bilaterally in order to allow
simultaneous kinematic measurement of nonparetic and paretic limbs in
either direction of motion (from left to right and vice-versa). In
addition, one calibration trial for each experimental condition was
videotaped wherein participants stood upright on the center of the
walkway facing both directions for a few seconds to register the neutral
position data of the joints and segments for further normalization of
the joint and segmental angles.
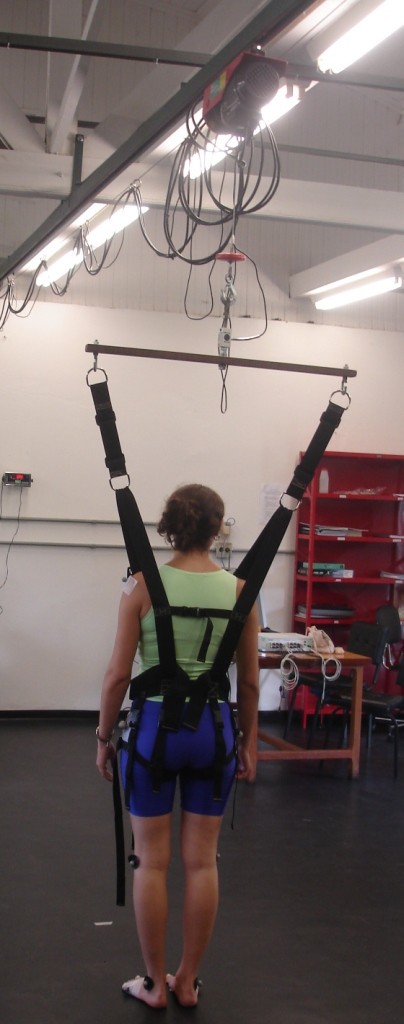
During the trials using the BWS
system, participants were mechanically supported in a harness with
adjustable belts and padded straps for the thighs, similar to the one
used by Norman et al. [17],
which was attached to a horizontal bar. A steel cable from an electric
motor pulled the horizontal bar upward and slid it through an upper rail
as the participants walked. A load cell connected the horizontal bar to
the cable and measured the amount of weight borne by the BWS system,
which was shown on a digital display. In order to support the weight,
participants stayed still until the motor was activated by the
experimenter, who lengthened or shortened the cable to bear the desired
amount of body weight. Figure 1 illustrates the BWS system used in the present study.
Figure 1
Partial view of the body weight support system used in the study. The rail that the electric motor slides along, the load cell, and one of the experimenters wearing the harness are shown.
Passive
reflective markers were placed on the nonparetic and paretic sides of
the body at the following anatomical locations: head of the fifth
metatarsal, lateral malleolus, lateral epicondyle of the femur, greater
trochanter, and acromion, in order to define the foot, shank, thigh, and
trunk segments, respectively. The digitalization and the reconstruction
of all markers were performed using Ariel Performance Analysis System -
APAS (Ariel Dynamics, Inc.) software, and filtering and posterior
analyses were performed using Matlab software (MathWorks, Inc. - Version
6.5). Reconstruction of the real coordinates was performed using the
direct linear transformation (DLT) procedure.
Data analysis
One
intermediate stride per trial by each participant, for a total of three
selected trials for each condition, was analyzed. The trial selection
was determined by the best visualization of the markers and walking
performance in an uninterrupted trial. Through visual inspection, a
stride (walking cycle) was defined by two consecutive initial contacts
of the same limb to the ground along the progression line. In addition,
walking events during a stride were identified for subsequent
calculation of walking temporal organization (initial and terminal
double stance, single limb support, and swing period [27]). This procedure was carried out for both nonparetic and paretic sides of the body
All the data were digitally filtered using a 4th
order and zero-lag Butterworth filter and all markers were low-pass
filtered at 8 Hz. For joint and segmental angles, strides were
normalized in time from 0 to 100%, with a 1% step. These cycles were
referenced to the participants' neutral angles measured during the
calibration trial in each condition and were then averaged to obtain the
mean cycle for each participant. The same procedure was repeated to
obtain the mean cycle among participants.
The following variables
were examined: mean walking speed, calculated as the ratio between the
distance traveled and its duration (determined by the position of the
greater trochanter marker, which is closer to the center of body mass);
stride length, the distance between two successive initial contacts of
each foot to the ground (determined by the position of the lateral
malleolus marker); stride speed, calculated as the ratio between stride
length and duration; durations of total double stance and single limb
support; ankle, knee, and hip joint range of motion, calculated from the
difference between the maximum and minimum angles of these joints
during each stride cycle; and foot, shank, thigh, and trunk segment
range of motion, calculated from the difference between the maximum and
minimum angles of these segments during each stride cycle. The movements
of the segments were counter-clockwise (backward) and clockwise
(forward) rotations around the medial-lateral axis on the sagittal
plane, which denoted positive and negative values, respectively [28].
For example, a counter-clockwise rotation of the trunk means trunk
extension from neutral position and a clockwise rotation means trunk
flexion from neutral position.
Statistical analysis
For
all variables, data from three trials under each condition were
averaged for each participant. A one-way analysis of variance (ANOVA)
was conducted, using the three experimental conditions (no harness, 0%
BWS, 30% BWS) as factors. Four multivariate analyses of variance
(MANOVAs) were employed, using body side (nonparetic and paretic) and
the three experimental conditions as factors. The dependent variables
were mean walking speed for the ANOVA, cadence, stride length, and
stride speed for the first MANOVA; durations of initial double stance,
single limb support, terminal double stance, and swing period for the
second MANOVA; ankle, knee, and hip joint range of motion for the third
MANOVA; and foot, shank, thigh, and trunk segmental range of motion for
the fourth MANOVA. When applicable, univariate analyses and Tukey post
hoc tests were employed. An alpha level of 0.05 was adopted for all
statistical tests, which were performed using SPSS software (Version
10.0).
Results
All
participants performed the requested tasks. None used assistive devices
during walking performance; however, three participants needed
assistance from a physical therapist that hold one of their hands, in
order to support balance when walking with no harness. The results for
walking spatial-temporal parameters and for joint and segmental pattern
and range of motion follow.
Temporal-spatial gait parameters
Table 1
depicts mean and standard deviation (± SD) of the walking cycle
temporal-spatial parameters. Walking speed was different among
conditions, F(2,24) = 5.56, p = 0.02, in which it was lower in the 30%
BWS than in the no harness condition. MANOVA revealed condition
significance, Wilks' Lambda = 0.54, F(6,44) = 2.65, p = 0.003, and
condition and body side interaction, Wilks' Lambda = 0.37, F(6,44) =
4.68, p = 0.001. Univariate analyses indicated condition effect and
condition and body side interaction for stride length, F(2,24) = 8.39, p
= 0.007, F(2,24) = 12.41, p < 0.001, and stride speed, F(2,24) =
4.96, p = 0.029, F(2,24) = 16.31, p p < 0.001, respectively. Stride
length was shorter and stride speed was lower in the 30% BWS than in the
no harness and 0% BWS conditions, and in the 0% BWS than in the no
harness condition. The paretic side displayed longer stride length and
faster stride speed than the nonparetic side only in the 30% BWS
condition (Table 1).
Table 1 Temporal-spatial parameters of walking during the stride cycle.
Regarding
temporal measures, MANOVA only revealed significant body side effect,
Wilks' Lambda = 0.14, F(4,9) = 13.71, p = 0.001. Univariate analyses
indicated that the nonparetic side displayed longer single limb support,
F(1,12) = 53.36, p p < 0.001, and shorter swing period duration,
F(1,12) = 65.88, p p < 0.001, than the paretic side of the body (Table 1).
Joint and segmental angles
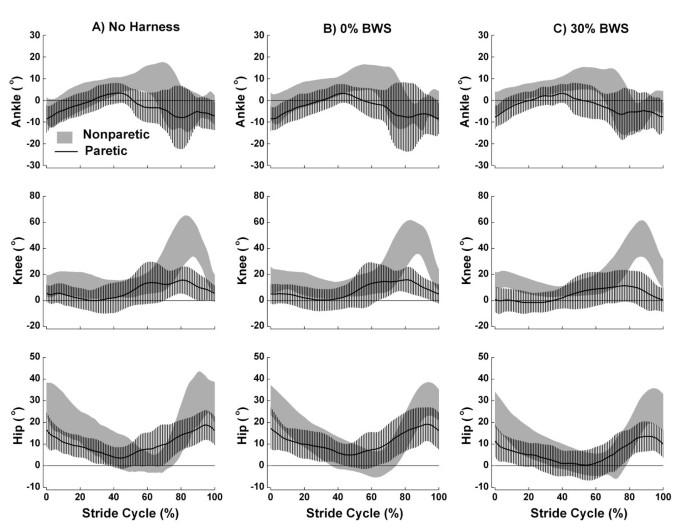
Figure 2
shows the mean (± SD) stride cycle of ankle, knee, and hip angle
patterns in the three conditions (no harness, 0% BWS, and 30% BWS) for
paretic and nonparetic sides of the body. Qualitatively, the joints of
either side have a similar pattern amongst conditions. However, joint
angles between sides presented a remarkably different pattern.
Figure 2
Ankle, knee, and hip joint angles during the stride cycle.
Mean (± SD) stride cycle of ankle, knee, and hip joint angles for the
individuals with chronic stroke walking with no harness (A), with 0% BWS
(B), and 30% BWS (C) on nonparetic (gray area) and paretic (line) body
sides. Positive values denote ankle dorsiflexion, knee and hip flexion,
and negative values denote ankle plantar flexion, knee and hip extension
(n = 13).
The
ankle joint of the paretic side showed plantar flexion during most of
the gait cycle, and little dorsiflexion during middle stance
(approximately 40% of the cycle) in the three conditions (Figure 2,
upper panel). On the other hand, the ankle of nonparetic side showed
marked dorsiflexion later in the cycle. The knee joint (Figure 2,
middle panel) showed little flexion on the paretic side considering
that this joint on the nonparetic side presented a much larger flexion
at swing period (approximately 85% of gait cycle) in the three
conditions. Finally, the hip joint (Figure 2,
bottom panel) showed a flexor pattern with little extension during the
entire cycle for both sides. However, the hip on the nonparetic side
showed greater flexion than the hip on the paretic side in the three
conditions.
Table 2
depicts mean (± SD) joint range of motion during the walking cycle.
MANOVA revealed joint range of motion had significant difference for
conditions, Wilks' Lambda = 0.52, F(6,44) = 2.87, p = 0.02, body side,
Wilks' Lambda = 0.09, F(3,10) = 33.73, p p < 0.001, and condition and
body side interaction tendency, Wilks' Lambda = 0.58, F(6,44) = 2.28, p =
0.053. The hip joint was influenced by condition, F(2,24) = 10.49, p =
0.004, with a greater range of motion in the no harness condition than
in the 30% BWS condition and a greater range of motion in the 0% BWS
than in the 30% BWS condition. Range of motion was greater on the
nonparetic side for the ankle, F(1,12) = 21.98, p = 0.001, knee, F(1,12)
= 41.91, p p < 0.001, and hip, F(1,12) = 102.97, p p < 0.001, than in
the paretic side (Table 2).
Table 2 Joint and segmental range of motion during the stride cycle.
Figure 3
shows the mean (± SD) stride cycle of foot, thigh, shank, and trunk
angle patterns in the three conditions for paretic and nonparetic sides
of the body. Most of segmental angles displayed similar pattern in the
three conditions, however, there were some different patterns between
sides.
Figure 3
Foot, shank, thigh, and trunk segmental angles during the stride cycle.
Mean (± SD) stride cycle of foot, shank, thigh, and trunk segmental
angles for the individuals with chronic stroke walking with no harness
(A), with 0% BWS (B), and 30% BWS (C) on nonparetic (gray area) and
paretic (line) body sides. Positive values denote counter-clockwise
(backward) rotation of segments and negative values denote clockwise
(forward) rotation of segments (n = 13).
The
foot remained close to neutral position during most of the stance
period on both sides. The foot on the nonparetic side presented greater
clockwise rotation and later than the foot on the paretic side in all
conditions (Figure 3,
upper panel). The same pattern was observed for shank. The thigh was
the only segment that presented a similar pattern between nonparetic and
paretic sides during most of the gait cycle. The thigh on the
nonparetic side showed a more counter-clockwise rotation than the thigh
on the paretic side (Figure 3,
middle panel), except at the end of the swing period. Finally, the
trunk presented an opposite orientation between nonparetic and paretic
sides and was close to neutral position with 30% BWS (Figure 3, bottom panel).
Table 2
also displays mean (± SD) segmental range of motion during the walking
cycle. MANOVA revealed segmental range of motion significant difference
for condition, Wilks' Lambda = 0.35, F(8,42) = 3.67, p = 0.003, body
side, Wilks' Lambda = 0.13, F(4,9) = 14.85, p = 0.001, and condition and
body side interaction, Wilks' Lambda = 0.24, F(8,42) = 5.54, p p <
0.001. Condition influenced thigh range of motion, F(2,24) = 17.08, p =
0.001, with greater range of motion in the no harness than in the 0% and
30% BWS conditions and greater range of motion in the 0% BWS than in
the 30% BWS condition. Body side influenced foot, F(1,12) = 35.77, p p < 0.001, and thigh, F(1,12) = 22.34, p p < 0.001, range of motion
with both segments showing a greater range of motion on the nonparetic
than on the paretic side. Finally, condition and body side interaction
was observed for the shank, F(2,24) = 20.40, p p < 0.001, and trunk,
F(2,24) = 8.08, p = 0.007, range of motion. Shank range of motion was
decreased throughout the no harness, 0% BWS, and 30% BWS conditions on
both sides, but with a greater decrease on the nonparetic than on the
paretic side. Trunk range of motion was decreased throughout the no
harness, 0% BWS, and 30% BWS conditions only on the paretic side and
presented a smaller range of motion on the nonparetic side in the no
harness and 0% BWS conditions than on the paretic side (Table 2).
Discussion
This
study investigated spatial-temporal gait parameters, and joint and
segmental angles of individuals with chronic stroke walking at
self-selected comfortable speed on ground level with and without BWS.
The results revealed that the use of BWS system leads to changes in
stride length and stride speed of individuals with chronic stroke, but
not on stance and swing period duration. Regarding the joint range of
motion, the hip was the only joint that was influenced by the BWS system
with the paretic side presenting less hip joint range of motion during
walking in the 30% BWS condition than in the no harness condition, and
the nonparetic side presenting less hip joint range of motion in the 30%
BWS than in the no harness and 0% BWS conditions. Finally, regarding
the segmental range of motion, shank and thigh segments presented less
range of motion in the 30% BWS condition than in the other conditions
and less range of motion in the 0% BWS condition than in the no harness
condition. The trunk on the paretic side presented less range of motion
in the 30% condition than in the other conditions and difference between
paretic and nonparetic sides was only observed in the 30% BWS
condition. These results did not support our initial suggestion that an
individual with stroke walking with BWS on ground level would present a
more stable and symmetrical gait pattern.
At first glance, it
seems that individuals with chronic stroke had more difficulty walking
with BWS on ground level than without it. However, one of the most
important issues regarding this study is that the BWS system enabled
these individuals to perform the task on a surface that is used in daily
life activities and none required assistance to keep their balance
because the BWS system enabled them to walk by themselves safely. In
interventions, the BWS provides physical support instead of the physical
therapist, who can then focus attention on the patient's walking
performance. For example, the physical therapist can focus on increased
walking speed and its influence on spatial-temporal parameters and joint
patterns [9] in the patient and correct gait pattern to favor a more symmetrical gait [10, 29].
The BWS system also provided steadiness during the single limb support
on the paretic side which led to a greater joint range of motion during
stepping. These results are quite encouraging for gait training using
BWS on ground level on a long-term basis.
Another positive aspect
of walking with BWS on ground level is the better vertical alignment of
the trunk throughout gait cycle (Figure 3,
bottom panel). We had investigated the trunk segment from both sides of
the body in the sagital plane of motion because of the posture that
individuals with stroke usually adopt for walking. This segment
presented different ranges of motion between nonparetic and paretic
sides, which means that the individuals rotated the trunk (longitudinal
axis of motion) towards the opposite side, which presented the largest
range of motion. In the 30% BWS condition, the trunk was close to
neutral position (i.e. erect) and did not present any difference between
nonparetic and paretic sides for range of motion. Trunk positioning is a
critical aspect of gait pattern, as its alignment is related to
functional performance [30], and it might contribute to a decreased mechanical energy cost [31]. Therefore, BWS on ground level contributes to aligning the trunk and provides advantages during gait performance.
Contrary to previous investigation of walking with BWS on ground level [15],
the participants in this study walked slower in the 30% BWS than in the
no harness condition. This difference might be attributed to the
different procedures adopted in each case. While Lamontagne and Fung [15]
investigated individuals with acute stroke and classified them
according to their walking speed as either low or high functioning
individuals, we evaluated individuals with chronic stroke and did not
classify them according to their preferred walking speed. Also, we did
not encourage our patients to speed up along the pathway, as Lamontagne
and Fung [15] did and also had evaluated their participants with stroke walking at preferred walking and maximal walking speed.
Slow
walking speed in the 30% BWS condition would be due to decreased
posterior muscle energy generation by the lower limb at the end of
terminal double stance. This aspect has been described as fundamental to
propel the limb forward to control the walking speed [32].
We had adopted 30% BWS for this study as it has been the most common
percentage of body weight support used during gait training with BWS on
treadmill and it was the percentage used in the previous study on ground
level [15].
However, it seems that this percentage for walking with BWS on ground
level might not be as appropriate as it is for walking with BWS on
treadmill, because it may prevent ground reaction force generation and,
consequently, the impulse to move the limb forward. In this way, future
studies using BWS on ground level in individuals with chronic stroke
should investigate a more appropriate percentage of body weight support
for this type of surface. Further, BWS systems that can be modulated
dynamically according to the gait phase have been proposed for treadmill
[33] and should also be considered for ground level.
An
unexpected finding was a longer stride length on the paretic side than
on the nonparetic side in the 30% BWS condition. Any human walking on a
straight line should present the same stride length on both sides [34],
but this was not the case in the present study. One possible
explanation for this finding could be that individuals with chronic
stroke took advantage of the body weight support on the single limb of
the nonparetic side to generate a longer and quicker step with the
paretic limb.
Our results, as in the previous investigation [15],
also showed that BWS itself did not change gait asymmetry between
nonparetic and paretic sides among the experimental conditions, which is
a prominent characteristic of hemiparetic gait [35, 36].
However, it is possible that side asymmetry might decrease only after a
gait training period with BWS on ground level, although this hypothesis
still needs to be further investigated.
Last but not least, the
0% BWS did not influence the mean walking speed, temporal symmetry,
ankle, knee, foot, and trunk ranges of motion. Although the harness was
employed mainly to help with balance, it also contributed to shortening
the stride length, lowering stride speed, and reducing hip, shank, and
thigh range of motion when compared to the no harness condition. These
reductions were lower in the 0% BWS condition than in the 30% BWS
condition. Thus, the use of harness itself was already enough to change
the gait pattern of individuals with stroke. This result might be due to
the BWS system adopted in this study because it required the
individuals to move the motor along the rail and to a lack of sufficient
adaptation to this walking requirement before taking part in the study.
In future studies, use of a BWS system for ground level in which the
motor is moved along the rail by a specific controller rather than by
the participant wearing the harness, should be considered. Actually, we
are currently working on the system in order to implement such a
condition.
To our knowledge, this was the first study that
considered a more detailed description of walking with BWS on ground
level in individuals with stroke and it presented some limitations.
First, a full understanding of gait requires more analyses than just the
kinematic approach, such as kinetic and electromyographyc analyses.
Second, the need to move the motor through the rail by the participants
creates a drag force as they walked and this can influence walking
performance and pattern. Third, only the 0% and 30% of BWS were analyzed
and participants might take advantage of other percentages of body
weight unloading especially due to the difficulty in force production to
move forward in the 30% of BWS condition. Finally, the adaptation
period provided to the participants might have not been long enough and
this could have masked some of the effects of BWS use. Despite all these
limitations, the use of BWS system overground seems to be a useful and
important strategy as a tool to provide an alternative intervention and
rehabilitation program for individuals with stroke.
Conclusion
Individuals
with stroke using BWS system on ground level walked slower and with
shorter stride length and slower stride speed, respectively, than with
no harness. BWS also led to a reduction in hip, shank, and thigh range
of motion. However, this system did not change walking temporal
organization and the body side asymmetry of individuals with stroke. The
differences found in this study might be attributed to the adjustments
the individuals had to make to walk with an unloading condition on the
lower limb, and to the brief period of adaptation to the BWS system, as
the use of the harness without support of body weight (0% BWS condition)
per se leads to some alterations during the task performance.
Although
the use of BWS system on ground level changed some gait parameters,
this system enabled individuals with chronic stroke to walk safely and
without physical assistance. In interventions, the physical therapist
can focus on watching and correcting the individual's gait pattern
during performance instead of providing physical assistance.