Changing stroke rehab and research worldwide now.Time is Brain! trillions and trillions of neurons that DIE each day because there are NO effective hyperacute therapies besides tPA(only 12% effective). I have 523 posts on hyperacute therapy, enough for researchers to spend decades proving them out. These are my personal ideas and blog on stroke rehabilitation and stroke research. Do not attempt any of these without checking with your medical provider. Unless you join me in agitating, when you need these therapies they won't be there.

What this blog is for:

My blog is not to help survivors recover, it is to have the 10 million yearly stroke survivors light fires underneath their doctors, stroke hospitals and stroke researchers to get stroke solved. 100% recovery. The stroke medical world is completely failing at that goal, they don't even have it as a goal. Shortly after getting out of the hospital and getting NO information on the process or protocols of stroke rehabilitation and recovery I started searching on the internet and found that no other survivor received useful information. This is an attempt to cover all stroke rehabilitation information that should be readily available to survivors so they can talk with informed knowledge to their medical staff. It lays out what needs to be done to get stroke survivors closer to 100% recovery. It's quite disgusting that this information is not available from every stroke association and doctors group.

Showing posts with label brain networks. Show all posts

Tuesday, December 3, 2024

High Blood Sugar Impacts Brain Health, Even Without Diabetes

 How long before your competent? stroke doctor writes up and implements a testing protocol for this AND creates a protocol to reduce levels safely?

The research is incomplete; what is the definition of high? Your mentors and senior researchers were TOTALLY INCOMPETENT in instructing you how to conduct research?

High Blood Sugar Impacts Brain Health, Even Without Diabetes

Summary: New research reveals that elevated blood sugar levels may harm brain health, even in people without diabetes. The study showed decreased connectivity in brain networks linked to cognition, memory, and emotion regulation, with stronger effects in older adults and women.

Elevated blood sugar was also tied to lower heart rate variability, an indicator of brain health. These findings underscore the importance of managing blood sugar through a healthy diet, regular exercise, and medical checkups to support both body and brain health.

Key Facts:

  • High blood sugar reduces connectivity in brain networks critical for cognition.
  • Older adults and women showed stronger effects from elevated blood sugar.
  • Low heart rate variability, linked to brain health, correlated with higher blood sugar.

Source: Baycrest

A study by Baycrest found that high blood sugar may impair brain health even in people without diabetes.

While the link between blood sugar and brain health is well documented in individuals living with diabetes, Baycrest is the first to examine this connection in people without this diagnosis.

This shows a brain.
Higher blood sugar was associated with decreased connection in brain networks. Credit: Neuroscience News

“Our results show that even if someone does not have a diabetes diagnosis, their blood sugar may already be high enough to be negatively impacting their brain health,” said Dr. Jean Chen, senior author on the study and Senior Scientist at the Rotman Research Institute, part of the Baycrest Academy for Research and Education (BARE).

“Blood sugar exists on a spectrum – it isn’t a black and white categorization of healthy or unhealthy.”

The study, titled “The associations among glycemic control, heart variability, and autonomic brain function in healthy individuals: Age- and sex-related differences,” was recently published in the journal Neurobiology of Aging and examined 146 healthy adults aged 18 and older.

For each individual, researchers analyzed blood sugar, brain activity using magnetic resonance imaging (MRI) scans and heart rate variability through electrocardiogram (ECG) readings.

“The findings highlight the importance of managing your blood sugar through healthy diet and exercise, not only for your body but also for your brain,” said Dr. Chen, who is also Baycrest’s Canada Research Chair in Neuroimaging of Aging and Professor of Biomedical Physics at the University of Toronto.

“It’s also important to get regular checkups and to work with a healthcare provider, especially if you have been diagnosed with pre-diabetes.

Main study findings

  • Higher blood sugar was associated with decreased connection in brain networks. These networks play a crucial role in all aspects of cognition including memory, attention and emotion regulation.
  • The effect was stronger in older adults, but it was present across all ages; older adults generally had higher blood sugar than younger adults.
  • The effect was also stronger in women than in men.
  • In addition, there was a link between higher blood sugar and lower heart rate variability – that is, the beat-to-beat change in an individual’s heart rate. Previous research indicates that higher heart-rate variability is associated with better brain health.

In future work, the researchers could further investigate how to improve brain function by changing heart-rate variability, which is an easier target for intervention than blood sugar, especially in non-diabetic individuals.

Funding: This study was conducted using data from the Leipzig Study for Mind-Body-Emotion Interactions (LEMON) dataset. It was funded by the Canadian Institutes of Health Research and the Natural Sciences and Engineering Research Council of Canada.

About this brain health research news

Author: Natasha Nacevski-Laird
Source: Baycrest
Contact: Natasha Nacevski-Laird – Baycrest
Image: The image is credited to Neuroscience News

Original Research: Open access.
The associations among glycemic control, heart variability, and autonomic brain function in healthy individuals: Age- and sex-related differences” by Jean Chen et al. Neurobiology of Aging

Thursday, April 14, 2022

Multi-Granularity Analysis of Brain Networks Assembled With Intra-Frequency and Cross-Frequency Phase Coupling for Human EEG After Stroke

How EXACTLY will this help survivors recover?  No answer, it was wasted research.

Multi-Granularity Analysis of Brain Networks Assembled With Intra-Frequency and Cross-Frequency Phase Coupling for Human EEG After Stroke

Bin Ren1,2, Kun Yang1,2, Li Zhu1,2, Lang Hu1,2, Tao Qiu3, Wanzeng Kong1,2 and Jianhai Zhang1,2*
  • 1College of Computer Science, Hangzhou Dianzi University, Hangzhou, China
  • 2Key Laboratory of Brain Machine Collaborative Intelligence of Zhejiang Province, Hangzhou, China
  • 3Department of Neurology, Zhejiang Provincial Hospital of Chinese Medicine, Hangzhou, China

Evaluating the impact of stroke on the human brain based on electroencephalogram (EEG) remains a challenging problem. Previous studies are mainly analyzed within frequency bands. This article proposes a multi-granularity analysis framework, which uses multiple brain networks assembled with intra-frequency and cross-frequency phase-phase coupling to evaluate the stroke impact in temporal and spatial granularity. Through our experiments on the EEG data of 11 patients with left ischemic stroke and 11 healthy controls during the mental rotation task, we find that the brain information interaction is highly affected after stroke, especially in delta-related cross-frequency bands, such as delta-alpha, delta-low beta, and delta-high beta. Besides, the average phase synchronization index (PSI) of the right hemisphere between patients with stroke and controls has a significant difference, especially in delta-alpha (p = 0.0186 in the left-hand mental rotation task, p = 0.0166 in the right-hand mental rotation task), which shows that the non-lesion hemisphere of patients with stroke is also affected while it cannot be observed in intra-frequency bands. The graph theory analysis of the entire task stage reveals that the brain network of patients with stroke has a longer feature path length and smaller clustering coefficient. Besides, in the graph theory analysis of three sub-stags, the more stable significant difference between the two groups is emerging in the mental rotation sub-stage (500–800 ms). These findings demonstrate that the coupling between different frequency bands brings a new perspective to understanding the brain's cognitive process after stroke.

1. Introduction

Stroke is a kind of cerebrovascular disease affecting the whole world. In most countries, stroke is the leading cause of the disability of adults and hinders the daily routine of patients and their families (Donkor, 2018). In recent years, neuroimaging techniques, such as CT, positron emission computed tomography (PET), functional MRI (fMRI), are often used in clinical treatment and disease research to monitor the neurological function of patients with stroke and explore the plastic reorganization mechanism of the brain (Rossini et al., 2003). However, these techniques are usually not portable and very expensive. Electroencephalogram (EEG) is a convenient and non-invasive technology with a high temporal resolution, which is suitable for monitoring, prognosis, and evaluating stroke disease (Monge-Pereira et al., 2017).

Previous research has proposed several Quantitative EEG (QEEG) features to evaluate brain activity changes after stroke, such as delta/alpha power ratio (Schleiger et al., 2014; Finnigan et al., 2016), brain symmetry index (Sheorajpanday et al., 2009; Sebastian-Romagosa et al., 2020), and laterality coefficients (Park et al., 2016). Besides, nonlinear parameters are also used in stroke research, such as Lempel Ziv complexity, sample entropy (Liu et al., 2016), and nonlinear separate degree (Zeng et al., 2017). These features are mainly analyzed based on single channels and cannot reflect the functional interactions between different brain regions. Therefore, some researchers explored the characteristics of the brain network after stroke. For instance, Philips et al. (2017) constructed brain networks in the beta band based on EEG data of the intensive therapeutic intervention period and found graph theoretical metrics are significant biomarkers to evaluate stroke rehabilitation. Although current studies reveal that oscillations in intra-frequency bands are reliable tools for exploring brain abnormality after stroke, the oscillatory mechanisms between different frequency bands have not been clearly understood.

More and more studies have shown complex brain information interaction between different frequency bands, known as cross-frequency coupling (CFC). Several brain regions of human and non-human primates found CFC phenomena, such as the hippocampus, prefrontal cortex, and sensory cortex (Mormann et al., 2005; Canolty et al., 2006; Jensen and Colgin, 2007; Khamechian and Daliri, 2020). Besides, increasing researchers use CFC to analyze cognitive and perceptual processes. For example, Dimitriadis et al. (2015) explored the coupling between the theta band and alpha band in the frontal lobe, parietal lobe, and occipital lobe during mental arithmetic tasks. Davoudi et al. (2021b) found an important parieto-occipital alpha-gamma coupling mechanism to rapidly select features from visual working memory storage. In the meantime, CFC shows advances in understanding the impact of many neurological diseases, including Alzheimer's disease (Cai et al., 2018), epilepsy (Jacobs et al., 2018; Yu et al., 2020), social anxiety disease (Poppelaars et al., 2018), and multiple sclerosis (Ahmadi et al., 2019). For instance, Jacobs et al. (2018) extracted cross-frequency phase-amplitude coupling features to predict seizures, and Yu et al. (2020) constructed the cross-frequency phase-phase coupling from seizure interval to seizure period. In human stroke-related studies of EEG signals, some studies focused on the CFC between EEG and other physiological signals, such as EMG (Xie et al., 2021) and cerebral blood flow velocity (Liu et al., 2019). Other studies investigated the CFC of EEG signals. For instance, based on the EEG data of the upper limb movement experiment, the effective network of 5 predefined motor cortex areas was constructed by dynamic causal modeling (DCM) to identify the biomarkers for classifying the patients' recovery state (Larsen et al., 2018). In addition, the DCM was utilized to investigate intra-cortex and inter-cortex effective connectivity of the 3 motor cortex areas in the intra-frequency and cross-frequency bands during the precision grip task in the stroke acute and sub-acute phase (Chen et al., 2017). In summary, the existing related studies on the cross-frequency analysis of EEG signals in patients with stroke mainly focus on the motor cortex during motor executive tasks. However, it may result in the obtained information being limited since it may lose potential information interactions between different brain regions. Moreover, the network information interaction of patients with stroke during the motor imagery process, which reveals the motor perception function after stroke, needs to be explored.

Mental rotation, a kind of motor imagery task, is conducive to restoring specific limbs' motor ability. Yan et al. (2013) constructed brain networks in beta bands based on the EEG data of patients with stroke and healthy controls during the mental rotation task and found significant alterations of the stroke brain in several temporal and spatial granularity. But this study has not explored the information interactions in cross-frequency bands. Previous analysis of healthy subjects in the mental rotation task found cross-frequency coupling between posterior parietal and frontal regions (Bertrand and Jerbi, 2009), which reveals the importance of CFC analysis in understanding the brain's mental rotation cognitive process. However, extracting effective features from CFC is more difficult than traditional intra-frequency coupling since the corresponding data is complicated and contains more hidden information. In addition, the cross-frequency features revealing the physiological mechanism of the brain requires to be deeply analyzed.

In this article, EEG data of patients with stroke and healthy controls during the mental rotation task is analyzed. A multi-granularity analysis framework is proposed, which uses multiple brain networks assembled with intra-frequency and cross-frequency phase coupling to evaluate the stroke impact in temporal and spatial granularity. In detail, spatial granularity includes analyzing the average phase synchronization index (PSI) at the whole brain area scale, hemisphere scale, and single-channel pairs scale. Besides, we also explore the brain networks in the temporal granularity, including graph theory analysis in the entire task stage and three sub-stages. The multi-granularity analysis shows that the brain information interaction of patients with stroke is highly affected in cross-frequency bands which demonstrates that the coupling of different frequency bands is an effective tool for exploring the impact of stroke.

More at link.


Friday, September 8, 2017

Nutrition has benefits for brain network organization, new research finds

The simple answer to this is for that great stroke association to write up a diet protocol and get it distributed to all stroke doctors and hospitals around the world. But first we need to destroy the fucking failures of stroke associations standing in the way and sucking money from productive uses.
https://news.illinois.edu/blog/view/6367/552515
HAMPAIGN, Ill. — Nutrition has been linked to cognitive performance, but researchers have not pinpointed what underlies the connection. A new study by University of Illinois researchers found that monounsaturated fatty acids – a class of nutrients found in olive oils, nuts and avocados – are linked to general intelligence, and that this relationship is driven by the correlation between MUFAs and the organization of the brain’s attention network.
The study of 99 healthy older adults, recruited through Carle Foundation Hospital in Urbana, compared patterns of fatty acid nutrients found in blood samples, functional MRI data that measured the efficiency of brain networks, and results of a general intelligence test. The study was published in the journal NeuroImage.
Aron Barbey is a professor of psychology at Illinois.
Photo by L. Brian Stauffer
“Our goal is to understand how nutrition might be used to support cognitive performance and to study the ways in which nutrition may influence the functional organization of the human brain,” said study leader Aron Barbey, a professor of psychology. “This is important because if we want to develop nutritional interventions that are effective at enhancing cognitive performance, we need to understand the ways that these nutrients influence brain function.”
“In this study, we examined the relationship between groups of fatty acids and brain networks that underlie general intelligence. In doing so, we sought to understand if brain network organization mediated the relationship between fatty acids and general intelligence,” said Marta Zamroziewicz, a recent Ph.D. graduate of the neuroscience program at Illinois and lead author of the study.
Studies suggesting cognitive benefits of the Mediterranean diet, which is rich in MUFAs, inspired the researchers to focus on this group of fatty acids. They examined nutrients in participants’ blood and found that the fatty acids clustered into two patterns: saturated fatty acids and MUFAs.
“Historically, the approach has been to focus on individual nutrients. But we know that dietary intake doesn’t depend on any one specific nutrient; rather, it reflects broader dietary patterns,” said Barbey, who also is affiliated with the Beckman Institute for Advanced Science and Technology at Illinois.
The researchers found that general intelligence was associated with the brain’s dorsal attention network, which plays a central role in attention-demanding tasks and everyday problem solving. In particular, the researchers found that general intelligence was associated with how efficiently the dorsal attention network is functionally organized using a measure called small-world propensity, which describes how well the neural network is connected within locally clustered regions as well as across globally integrated systems.
In turn, they found that those with higher levels of MUFAs in their blood had greater small-world propensity in their dorsal attention network. Taken together with an observed correlation between higher levels of MUFAs and greater general intelligence, these findings suggest a pathway by which MUFAs affect cognition.
“Our findings provide novel evidence that MUFAs are related to a very specific brain network, the dorsal attentional network, and how optimal this network is functionally organized,” Barbey said. “Our results suggest that if we want to understand the relationship between MUFAs and general intelligence, we need to take the dorsal attention network into account. It’s part of the underlying mechanism that contributes to their relationship.”
Barbey hopes these findings will guide further research into how nutrition affects cognition and intelligence. In particular, the next step is to run an interventional study over time to see whether long-term MUFA intake influences brain network organization and intelligence.
“Our ability to relate those beneficial cognitive effects to specific properties of brain networks is exciting,” Barbey said. “This gives us evidence of the mechanisms by which nutrition affects intelligence and motivates promising new directions for future research in nutritional cognitive neuroscience.”
This work was conducted through a partnership between the University of Illinois and Abbott Nutrition at the Center for Nutrition, Learning and Memory.
Editor’s notes: To reach Aron Barbey, call 217-244-2551; email barbey@illinois.edu.
The paper “Nutritional status, brain network organization, and general intelligence” is available online. DOI: 10.1016/j.neuroimage.2017.08.043

Saturday, August 5, 2017

Modularity metric summarizes network fragmentation to explain aphasia recovery differences

I could see nothing useful here that would help you recover from aphasia
https://m.medicalxpress.com/news/2017-08-modularity-metric-network-fragmentation-aphasia.html
While it is common for people who have had a stroke to experience language disturbances (aphasia), approximately 60 to 70 percent of survivors recover their ability to produce language within six months. The other 30 to 40 percent of stroke patients, however, suffer permanent aphasia.
Differences between patients in the degree to which is eventually recovered are not well understood. Currently, the only prognostic estimate that clinicians can provide is an educated guess based largely on the size and location of the stroke lesion, which can be frustratingly inaccurate. Some researchers think variations in recovery may be caused by an undetected fragmentation or disorganization of brain networks that disrupts the transfer of information in areas that may be far from the lesion itself.
To investigate this theory, MUSC researchers, under the guidance of Leonardo Bonilha, M.D., Ph.D., associate professor of neurology, worked in close collaboration with a team led by Julius Fridriksson, Ph.D., professor of Communication Sciences and Disorders at the University of South Carolina's Arnold School of Public Health, to map entire brain networks and assess post-event connectivity in 90 people who had suffered a left hemisphere stroke.
Barbara Marebwa, a Ph.D. candidate in MUSC's Department of Neurology, and lead author, explains, "Not a lot is known about the underlying mechanisms behind differences in language recovery. We think disruption of the network structure might be responsible. So, we wanted to look at how the entire brain was connected after the stroke. Instead of focusing on the damaged region, we looked at areas they still had to work with, and mapped those networks to see associations with their aphasia severity."
Study participants underwent language testing to establish a global aphasia severity score, followed by magnetic resonance image (MRI) scanning. By dividing the brain into 189 regions and mapping each participant's stroke lesion, the investigators could identify and focus on white- and grey-matter areas outside of the directly affected region. A connectivity map (or connectome) was created for each patient reflecting existing neural networks within and between these .
The team then partitioned these connectivity maps into modules and calculated a 'modularity metric' for each participant. "This metric helps you see how well different brain regions are connected both within themselves and to other areas. The different brain areas are like people at a party - they sit and talk together in cliques based on some connection or shared similarity. Modularity shows us how tight those cliques are. Areas that are tightly connected within themselves but not to others have high modularity," says Marebwa.
Bonilha adds, "The way the brain is connected is not random or haphazard - there's a balance between how much regions need to be integrated or connected and how much they need to be separated. Modularity reflects that community structure. Isolated areas no longer work with the rest of the team. So, modularity is one number that tells you how well various brain areas are able to communicate or share information."
Language is a highly complex function. To produce speech, distant brain areas must be able to accurately share information and translate it into sounds. The study, funded by the National Institute of Deafness and other Communication Disorders and the American Heart Association, assessed the overall brain network and summarized overall brain health based on connectivity, which provided important information about why and to what degree language abilities can recover.
Modularity was significantly correlated with patients' aphasia scores, so that the higher the left hemisphere modularity, the more severe the aphasia (r= -0.42; p<0.00001). In addition, patients with highly fragmented left hemisphere community structure had more severe aphasia (r= -0.43; p<0.0001) - a correlation that held after controlling for white matter damage (r=-0.22; p=0.0175). Thus, patients with comparable white matter damage, lesion size, and location but different fragmentation patterns had very different language abilities. For example, one patient with a lesion volume of 76.1 cm3, mean white matter damage of 0.099, and 4 left hemisphere modules had an aphasia score of 88.1. Meanwhile, another patient with similar lesion volume (99.24 cm3) and mean white matter damage (0.096), but more left hemisphere modules (9), had an aphasia score of 58.2. The second patient, then, had a more fragmented left hemisphere and more severe aphasia (lower aphasia scores indicate more severe aphasia).
Says Marebwa, "It was surprising that even when we controlled for lesion location and size, it was still significant. Modularity was a better predictor of aphasia severity than some of the other estimates that rely on the size and location of the stroke - plus it gives us a lot of new information. Modularity helps us explain why some patients do better than others with their aphasia recovery. We hope that one day we'll be able to use it to predict recovery and steer therapies, but we're not quite there yet."
A novel aspect of this study was the complex mathematical algorithms that the team used to calculate modularity. Bonilha explains, "Barbara comes to neurology research from a technical imaging background and so she has a unique ability to combine complex network mathematical models with clinical imaging studies to help us better understand brain networks. This is a new approach - there's currently no measure of 'brain health'. We talk about small vessel changes but we don't know how much those affect the network and the brain's ability to function. It's a new frontier to have a computational method to calculate how well the brain is functioning by looking at network connectivity and to have a single number indicating that. This may be a useful new metric of brain health, which can help us understand recovery from neurological injury, or identify problems in healthy individuals long before clinical symptoms appear."
Eventually, modularity as a measure of brain organization and function, may be put to use in other conditions, such as dementia. The team is already working on studies in people without stroke but who have other chronic conditions that are known to impact brain health. "We're expanding the application of our imaging calculations to cardiovascular disease, hypertension, and diabetes, to try to see how these conditions may contribute to disrupting networks. How that may affect patients' resilience or recovery," says Marebwa.
More information: Leonardo Bonilha et al, Temporal lobe networks supporting the comprehension of spoken words, Brain (2017). DOI: 10.1093/brain/awx169
Provided by: Medical University of South Carolina

Monday, February 13, 2017

Growing a Cellular Tree With Healthy Branches

We need this for dendrite outgrowth. What is your doctor doing to followup with the researchers to create a stroke protocol or start human research on this? If nothing is being done you will need to call the hospital president and ask that that incompetent doctor is fired. We have to clear out the dead wood somehow or we will always be stuck at 10% full recovery. I will not be polite in the face of proven incompetency.
http://neurosciencenews.com/dendrites-genetics-axons-4131/

Univ. of Iowa biologists show how brain cells get the message to develop a signaling network.
When you think of a neuron, imagine a tree.
A healthy brain cell indeed looks like a tree with a full canopy. There’s a trunk, which is the cell’s nucleus; there’s a root system, embodied in a single axon; and there are the branches, called dendrites.
Neurons in your brain pass signals from one to another like they’re playing an elaborate, lightning-quick game of telephone, using axons as the transmitters and dendrites as the receivers. Those signals originate in the brain and are passed throughout the body, culminating in simple actions, such as wiggling a toe, to more complex instructions, such as following through on a thought.
Just as you can judge a healthy tree by its canopy, so too can scientists judge a healthy neuron by its dendritic branches. But it had been unclear what causes dendrites to grow, and where those instructions to grow come from.
Biologists at the University of Iowa have determined a group of genes associated with neurons help regulate dendrites’ growth. But there’s a catch: These genes, called gamma-protocadherins, must be an exact match for each neuron for the cells to correctly grow dendrites.
The findings may offer new insight into what causes aggressive or stunted dendrite growth in neurons, which could help explain the biological reasons for some mental-health diseases, as well as help researchers better understand brain development in babies born prematurely.
“Disrupted dendrite arborization is seen in the brains of people with autism and schizophrenia, so processes like the one we have uncovered here may have relevance to human disorders,” says Joshua Weiner, a molecular biologist at the UI and corresponding author on the paper, published online this month in the journal Cell Reports.
Gamma-protocadherins are called “adhesion molecules” because they stick out from a cell’s membrane to bind and hold cells together. The researchers learned about their role by giving a developing brain cell in a mouse the same gamma-protocadherin as in surrounding cells. When they did, the cells grew longer, more complex dendrites. But when the researchers outfitted a mouse neuron with a different gamma-protocadherin than the cells around it, dendritic growth was stunted.
The human brain is filled with neurons. Scientists think adults have 100 billion brain cells, each in close proximity to others and all seeking to make contact through their axons and dendrites. The denser a neuron’s dendritic network, the more apt a cell is to be in touch with another and aid in passing signals.
Gamma-protocadherins act like molecular Velcro, binding neurons together and instructing them to grow their dendrites. Weiner and his team figured out their role when they observed paltry dendritic growth in mouse brain cells where the gamma-protocadherins had been silenced.
The researchers went further in the new study. Using mice, they expressed the same type of gamma-protocadherin (labeled either as A1 or C3) in neurons in the cerebral cortex, a region of the brain that processes language and information. After five weeks, the neurons had sizeable dendritic networks, indicative of a healthy, normally functioning brain. Likewise, when they turned on a gamma-protocadherin gene in a neuron different from the gamma-protocadherin gene with the cells surrounding it, the mice had limited dendrite growth after the same time period.
That’s important because human neurons carry up to six gamma-protocadherins, meaning there are many combinations potentially in play. Yet, it seems the “grow your dendrite” signal only happens when neurons carrying the the same gamma-protocadherin gene pair up.

Thursday, January 26, 2017

Brain Networks Under Attack: Robustness Properties and the Impact of Lesions

Based on this you will need to ask your doctor how badly damaged your brain network was as a result of your stroke and EXACTLY what stroke protocols will bring that network back to full function.  I don't care how fucking hard this is for your doctor to do, trying living with a stroke. No response means you need to find another doctor, you likely will need to go through thousands before you find one that at least is conversant in the topic of stroke.  A great stroke association would know about and train doctors in these topics but we have fucking failures of stroke associations instead.
http://www.medscape.com/viewarticle/874308?src=wnl_edit_tpal

Abstract

A growing number of studies approach the brain as a complex network, the so-called 'connectome'. Adopting this framework, we examine what types or extent of damage the brain can withstand—referred to as network 'robustness'—and conversely, which kind of distortions can be expected after brain lesions. To this end, we review computational lesion studies and empirical studies investigating network alterations in brain tumour, stroke and traumatic brain injury patients. Common to these three types of focal injury is that there is no unequivocal relationship between the anatomical lesion site and its topological characteristics within the brain network. Furthermore, large-scale network effects of these focal lesions are compared to those of a widely studied multifocal neurodegenerative disorder, Alzheimer's disease, in which central parts of the connectome are preferentially affected. Results indicate that human brain networks are remarkably resilient to different types of lesions, compared to other types of complex networks such as random or scale-free networks. However, lesion effects have been found to depend critically on the topological position of the lesion. In particular, damage to network hub regions—and especially those connecting different subnetworks—was found to cause the largest disturbances in network organization. Regardless of lesion location, evidence from empirical and computational lesion studies shows that lesions cause significant alterations in global network topology. The direction of these changes though remains to be elucidated. Encouragingly, both empirical and modelling studies have indicated that after focal damage, the connectome carries the potential to recover at least to some extent, with normalization of graph metrics being related to improved behavioural and cognitive functioning. To conclude, we highlight possible clinical implications of these findings, point out several methodological limitations that pertain to the study of brain diseases adopting a network approach, and provide suggestions for future research.

Introduction

Throughout the history of cognitive neuroscience, there has been an ongoing debate as to whether cognitive functions are localized within specific regions of the brain or emerge from dynamical interactions between various brain areas (Catani et al., 2012). Recent advances in non-invasive in vivo neuroimaging technology now allow the construction of comprehensive whole-brain maps of the structural and functional connections of the human cerebrum at the individual level. The ensemble of macroscopic brain connections can then be described as a complex network—the 'connectome' (Hagmann, 2005; Sporns et al., 2005). Using graph theory, a powerful framework to characterize diverse properties of complex networks, it has been consistently demonstrated that the human connectome reflects an optimal balance between segregation and integration (Sporns, 2013). Thereby, both perspectives on the origin of cognitive functions have been unified.
Providing a novel perspective to study the brain's organization and functioning in health and disease, connectome analysis has found rapid applications in clinical neuroscience. Disturbed interactions among brain regions have been found in nearly all neurological, developmental and psychiatric disorders (Griffa et al., 2013; van Straaten and Stam, 2013; Cao et al., 2015; Fornito and Bullmore, 2015). In addition, relationships between network topology and cognitive functioning have been revealed. For example, strong positive associations have been found between global efficiency of structural and functional networks and intellectual performance (Li et al., 2009; van den Heuvel et al., 2009). Hence, network analysis could be used to identify biomarkers of specific brain functions and symptoms, thereby carrying the potential to allow more objective diagnosis, to monitor recovery or progression processes over time, and to predict effective treatment options.
In addition, the availability of structural and functional connectomes has enabled the construction and validation of computational models of large-scale neuronal activity (Ghosh et al., 2008; Deco and Kringelbach, 2014). In particular, dynamical models can be implemented on the structural connectome to simulate brain activity, after which predicted and empirical functional connectivity can be compared to evaluate model performance. Overall, it has been demonstrated that brain activity strongly depends on the underlying structural connectivity (Deco and Corbetta, 2011). By virtually lesioning structural connectomes, computational models thus can be used as unique predictive tools to investigate the impact of diverse structural connectivity alterations on brain dynamics. That is, computational modelling enables us to investigate what types or extent of damage the brain can withstand—referred to as network 'robustness'—and conversely, which kind of distortions can be expected after brain lesions, including those purposively induced by surgery. Furthermore, biologically inspired dynamical models can provide insights into the local dynamics underlying large-scale network topology in health and disease. Hence, they may provide an entry point for understanding brain disorders at a causal mechanistic level. This might lead to novel, more effective therapeutic interventions, for example through drug discovery, optimized presurgical planning, and new targets for deep brain stimulation (Deco and Kringelbach, 2014).
In this review, we briefly discuss how the brain can be studied from a complex networks perspective. Adopting this perspective, we focus on the properties of brain networks underlying network robustness. In turn, we review computational lesion studies and empirical studies investigating network alterations in brain tumour, stroke and traumatic brain injury (TBI) patients. Common to these three types of focal injury is that there is no clear mapping between the anatomical lesion site and its topological characteristics within the brain network. Furthermore, large-scale network effects of these focal lesions are compared to those of a widely studied multifocal neurodegenerative disorder, Alzheimer's disease, in which central parts of the connectome are preferentially affected. To conclude, we highlight potential clinical implications of these findings, point out several methodological limitations that pertain to the study of brain diseases adopting a network approach and provide suggestions for future research.

8 more pages to go.

Tuesday, November 22, 2016

Bruker launches Ultima NeuraLight 3D imaging platform for neuroscience applications

What is the strategy behind using this to decode the neural networks  behind neuroplasticity and neurogenesis? I'm willing to bet nothing because fully understanding exactly how to make neurogenesis and neuroplasticity totally repeatable will never become a research focus until survivors are running the stroke leadership and strategy.
http://www.news-medical.net/news/20161115/Bruker-launches-Ultima-NeuraLight-3D-imaging-platform-for-neuroscience-applications.aspx
New Ultima NeuraLight 3D Advances Research in Neural Connectivity and Networks
At the 46th Annual Meeting of the Society for Neuroscience, Bruker (NASDAQ: BRKR) today announced the release of the Ultima NeuraLight 3D™ simultaneous, all-optical stimulation and imaging platform for neuroscience applications.
The NeuraLight 3D module is the most advanced 3D holographic solution for multi-cell brain research to decode neural connectivity and neural networks. Bruker’s proprietary spatial light module (SLM) technology enables the mapping of neural networks on an unprecedented level with respect to stimulation frequency and spatial resolution on both in vivo and in vitro experimental models.

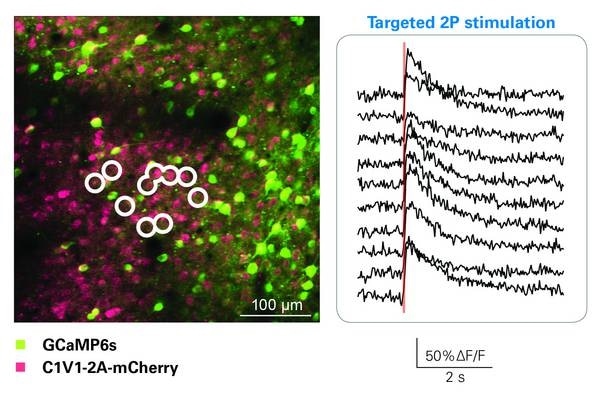
Optical stimulation of selected cells containing GCaMP6s using NeuraLight 3D. Cell bodies were stimulated simultaneously by creating a 3D hologram of points with the SLM and spiral scanning all points over the cell body. Courtesy of Adam Packer, Lloyd Russell, Henry Dalgleish, and Michael Hausser (University College London).
This significant breakthrough in 3D optical stimulation, in conjunction with multiphoton microscopy, was achieved in close collaboration with leaders in neuroscience research at Stanford University, Columbia University, and University College London.
The Ultima SLM opens the door to previously impossible experiments for patterned all-optical interrogation of neuronal circuits,”
Professor Michael Hausser of University College London.

Ultima NeuraLight 3D builds on over 15 years of experience of developing flexible, modular, and highest performance multiphoton microscopy for neuroscience research,” explained Xiaomei Li, Ph.D., Vice President and General Manager for Bruker’s Fluorescence Microscopy Business Unit.
“This history gives us an intimate understanding of the challenges facing today’s neuroscientists, and the unique ability to provide enabling technology for the next step in cutting-edge optogenetics research.”

About Ultima NeuraLight 3D

The Ultima NeuraLight 3D builds on the modular platform design of Bruker’s Ultima Multiphoton Microscopes to further augment its capabilities. The Ultima platform has a proven track record of facilitating cutting-edge research in neuroscience by pioneering advanced photoactivation and photostimulation of biological tissues. NeuraLight 3D is the next step in this platform of game-changing products.
The NeuraLight 3D module mates to one of the Ultima’s optical ports, and in coordination with new licensed technology, enables researchers to create a 3D laser hologram to simultaneously stimulate cells in three dimensions.
With a comprehensive software toolkit, NeuraLight 3D is able to generate and rapidly switch between 3D activation patterns, while imaging, recording electrical signals, and triggering behavioral and electrical stimuli, all at industry-leading switching rates of 300 to 500 hertz.
The number of targets that can be activated and observed is limited only by the peak power of the laser used for stimulation. The Ultima NeuraLight 3D module is available as an option for all new Ultima multiphoton systems, and as an upgrade to Ultima systems produced since 2006.

Sunday, November 20, 2016

Editorial: Anatomy and Plasticity in Large-Scale Brain Models

 What is your doctor and hospital doing to contact these supercomputing facilities for information on how these brain networks work in stroke damage?  ANYTHING AT ALL?
What is your doctor and hospital doing to contact these suphttp://journal.frontiersin.org/article/10.3389/fnana.2016.00108/full
  • 1Simulation Laboratory Neuroscience, Bernstein Facility for Simulation and Database Technology, Institute for Advanced Simulation, Jülich Aachen Research Alliance, Jülich Research Center, Jülich, Germany
  • 2Faculty of Engineering and Mathematics, Bielefeld University of Applied Sciences, Bielefeld, Germany
  • 3Department of Integrative Neurophysiology, VU University Amsterdam, Amsterdam, Netherlands
The Editorial on the Research Topic
Anatomy and Plasticity in Large-Scale Brain Models

Introduction

Supercomputing facilities are becoming increasingly available for simulating electrical activity in large-scale neuronal networks. On today's most advanced supercomputers, networks with up to a billion of neurons can be readily simulated. However, building biologically realistic, full-scale brain models requires more than just a huge number of neurons. In addition to network size, the detailed local and global anatomy of neuronal connections is of crucial importance. Moreover, anatomical connectivity is not fixed, but can rewire throughout life (structural plasticity; Butz et al., 2009)—an aspect that is missing in most current network models, in which plasticity is confined to changes in synaptic strength (synaptic plasticity).
The papers in this research topic, which may broadly be divided into three themes, aim to bring together high-performance computing with recent experimental and computational research in neuroanatomy. In the first theme (fiber connectivity), new methods are described for measuring and data-basing microscopic and macroscopic connectivity. In the second theme (structural plasticity), novel models are introduced that incorporate morphological plasticity and rewiring of anatomical connections. In the third theme (large-scale simulations), simulations of large-scale neuronal networks are presented with an emphasis on anatomical detail and plasticity mechanisms. Together, the papers in this research topic contribute to extending high-performance computing in neuroscience to encompass anatomical detail and plasticity.

Fiber Connectivity

Investigating the brain's connectivity requires multiscale approaches and hence strategies for integrating data across different spatial scales. Axer et al. demonstrate how to bridge microscopic visualizations of fibers obtained by 3D-PLI (polarized light imaging; Axer et al., 2011) to meso- or macro-scopic fiber orientations based on dMRI (diffusion magnetic resonance imaging). A relatively new technique, 3D-PLI is applicable to microtome sections of postmortem brains and uses birefringence of brain tissue, induced by optical anisotropy of the myelin sheaths around axons, to derive a 3D description of the underlying fiber architecture. To be able to link 3D-PLI to dMRI measurements, the authors introduce fiber orientation distribution functions (ODFs) extracted from 3D-PLI. They demonstrate the validity of their approach with simulated 3D-PLI data as well as real 3D-PLI data from the human brain and the brain of a hooded seal.
Capturing different aspects of brain organization, such as connectivity and molecular composition, necessitates the use of different neuroimaging techniques. To subsequently integrate the multiscale and multimodal data into a complete 3D brain model requires an accurate definition of the spatial positions of structural entities. Defined by MRI, the Waxholm Space (WHS) (http://software.incf.org/software/waxholm-space) provides such a reference space for rodent brain data. The aim of the study by Schubert et al. was to extend the WHS rat brain atlas with information about cytoarchitecture, receptor expression and spatial orientation of fiber tracts, derived from autoradiography and PLI images. To incorporate these distinct classes of information into the WHS, the authors improved currently available registration algorithms to align sections and to correct for deformations. The extended WHS rat brain atlas now enables combined studies on receptor and cell distributions as well as fiber densities in the same anatomical structures at microscopic scales. Furthermore, the methods developed facilitate future integration of data of other modalities.
More at link.

Friday, November 4, 2016

Brain scientists at TU Dresden examine brain networks during short-term task learning

But does incorrect practice make perfection faster? Don't researchers read research at all?

Practice makes perfect — or does it?


http://www.alphagalileo.org/ViewItem.aspx?ItemId=169659&CultureCode=en
“Practice makes perfect” is a common saying. We all have experienced that the initially effortful implementation of novel tasks is becoming rapidly easier and more fluent after only a few repetitions. This works especially efficient when we are guided by explicit instructions. A team of researchers at TU Dresden has now examined the underlying neural processes in a current imaging study. The results of the study are published today in the prestigious scientific journal “Nature Communications” under the title „Integration and segregation of large-scale brain networks during short-term task automatization”.
Within the collaborative research center 940 ‘volition and cognitive control’ sponsored by the DFG (German Science Foundation), the brain scientists Holger Mohr, Uta Wolfensteller, and Hannes Ruge from the Department of Psychology at Technische Universität Dresden (Germany) in collaboration with colleagues from the USA and Switzerland examined the neural processes responsible for the automatization of instruction-based tasks. Their research approach embraced the currently popular assumption that mental functions like memory or language do emerge from specific patterns of communication within and between subnetworks of the brain. Going beyond this basic assumption, it was examined whether a rapid reorganization of these communication patterns is possible – specifically during the rapid instruction-based automatization of novel tasks. Previous studies in this context mainly focused on long-term changes.
The results of this current study suggest that rapid instruction-based task automatization is facilitated by rapidly increasing communication between subnetworks associated with the transformation of visual information into motor responses. At the same time, this is accompanied by a release of network resources initially serving the controlled and attention-demanding implementation of the instructed task – while the so-called default mode network is increasingly decoupled from task-related networks. Together, these findings suggest that rapid instruction-based task automatization is indeed reflected by a rapid system-level reorganization of network communications distributed across the entire brain.
Please find the complete paper at: http://www.nature.com/articles/ncomms13217
https://tu-dresden.de/mn/psychologie/allgpsy/die-professur/mitarbeiter/utawolfensteller/agneuro

Attached files

  • Increasing communication between the cingulo-opercular network and the dorsal attention network (left side), and decoupling of the default mode network from the cingulo-opercular network (right side) during short practice phases.

Friday, September 30, 2016

Scientists uncover how a fluctuating brain network may make us better thinkers

Have your doctor figure out what protocols help you have a fluctuating brain network. Is it part of your brain reserve?
http://medicalxpress.com/news/2016-09-scientists-uncover-fluctuating-brain-network.html
For the past 100 years, scientists have understood that different areas of the brain serve unique purposes. Only recently have they realized that the organization isn't static. Rather than having strictly defined routes of communication between different areas, the level of coordination between different parts of the brain seems to ebb and flow.
Now, by analyzing the brains of a large number of people at rest or carrying out , researchers at Stanford University have learned that the integration between those regions also fluctuates. When the brain is more integrated people do better on complex tasks. The research was published in Neuron.
"The brain is stunning in its complexity and I feel like, in a way, we've been able to describe some of its beauty in this story," said study lead author Mac Shine, a postdoctoral researcher in the lab of Russell Poldrack, a professor of psychology "We've been able to say, 'Here's this underlying structure that you would never have guessed was there, that might help us explain the mystery of why the brain is organized in the way that it is.'"
Brain connections at rest and at work
In a three-part project, the researchers used open source data from the Human Connectome Project to examine how separate areas of the brain coordinate their activity over time, both while people are at rest and while they are attempting a challenging mental task. They then tested a potential neurobiological mechanism to explain these findings.
For the resting state condition, the researchers used a novel analysis technique to examine imaging (fMRI) data – which shows in real time which areas of the brain are active – of people who weren't doing any particular task. The analysis estimates the amount of blood flow in pairs of and then uses the mathematics of graph theory to summarize the way that the whole network of the brain is organized. They found that even without any intentional stimulation, the brain network fluctuates between periods of higher and lower coordinated in the different areas of the brain.
To determine whether these fluctuations were relevant for the function of the brain, the researchers used fMRI data from people who had successfully performed a challenging memory test.
The researchers found that the brains of participants were more integrated while working on this complicated task than they were during quiet rest. Scientists have previously shown that the brain is inherently dynamic but further statistical analysis in this study revealed that the brain was most interconnected in people who performed the test fastest and with the greatest accuracy.
"My background is in cognitive psychology and cognitive neuroscience, and stories about how the brain works that don't relate back to behavior don't really do much for me," said co-author Poldrack. "But this research shows these really clear relationships between how the brain is functioning at a network level and how the person's actually performing on these psychological tasks."
Amplifying brain interconnectedness
As a final step in their study, the researchers measured pupil size to try and tease out how the brain coordinates this change in connectivity. Pupil size is an indirect measure of the activity of a small region in the brainstem called the locus coeruleus that is thought to amplify or mute signals across the entire brain. Up to a certain point, increases in pupil size likely indicate greater amplification of strong signals and greater muting of weak signals across the brain.
The researchers found that roughly tracked with changes in brain connectivity during rest, in that larger pupils were associated with greater connectedness. This suggests that the noradrenaline coming from the might be what drives the brain to become more integrated during highly complicated cognitive tasks, allowing a person to perform well on that task.
The value of curiosity-driven science
The researchers plan to further investigate the connection between neural gain and integration in the brain. They also want to figure out how universal these findings are to other behaviors, such as attention and memory. This research may also eventually help us better understand cognitive disorders, such as Alzheimer's disease or Parkinson's disease, but Shine stressed that this was a curiosity-driven investigation, fueled by the passion to simply know more about the brain.
"I think we were really lucky here, in that we had an exploratory question that bore fruit," said Shine. "Now, we're in a position where we can ask new questions that will hopefully help us to make progress in understanding the brain."
More information: The Dynamics of Functional Brain Networks: Integrated Network States during Cognitive Function, arXiv:1511.02976 [q-bio.NC] arxiv.org/abs/1511.02976

Journal reference: Neuron search and more info website

Thursday, September 29, 2016

Brain network analysis: a practical tutorial

Ask your doctor how your stroke disrupted your brain networks. Specifics only, not generic crap your doctor will try to pass off as knowledgeable. What protocols will fix those networks?
http://brain.oxfordjournals.org/content/early/2016/09/16/brain.aww232.extract

Restricted access
DOI: http://dx.doi.org/10.1093/brain/aww232 aww232 First published online: 19 September 2016

How are our brains wired? How are pathways between neurons organized? What patterns of connections allow us to think the way we do, or distinguish our ways of thinking from those of other animals? These and related questions are the bread and butter of an excellent new textbook.
FUNDAMENTALS OF BRAIN NETWORK ANALYSIS
By Alex Fornito, Andrew Zalesky and Edward Bullmore, 2016 Elsevier (Academic Press) ISBN 978-0-12-407908-3 Price: £60.99
Fundamentals of Brain Network Analysis by Fornito, Zalesky and Bullmore, is a thorough and didactic presentation of the tools available to research scientists wishing to engage in the emerging field of network neuroscience (Bullmore and Sporns, 2009). Blending computational tools and mathematical frameworks from physics, engineering, statistics, and computer science with the reams of data now being collected from diverse neural systems, network neuroscience is a truly interdisciplinary and ground-breaking field poised to transform our understanding of the brain. Rather than focusing solely on the function of single neurons or brain regions, these efforts expand the purview of our interests to the pattern of interactions between neural …
View Full Text

Friday, September 9, 2016

The “Hub Disruption Index,” a Reliable Index Sensitive to the Brain Networks Reorganization. A Study of the Contralesional Hemisphere in Stroke

Your doctor should be able to explain how the good side of your brain is going to help you recover and the protocols necessary to accomplish that. But that is a sick joke since your doctor has no clue how to do that.
http://journal.frontiersin.org/article/10.3389/fncom.2016.00084/full?
Maite Termenon1,2*, Sophie Achard3,4, Assia Jaillard5,6,7 and Chantal Delon-Martin1,2
  • 1Grenoble Institut des Neurosciences, Université Grenoble Alpes, Grenoble, France
  • 2Institut National de la Santé et de la Recherche Médicale, U1216, Grenoble, France
  • 3GIPSA-Lab, Université Grenoble Alpes, Grenoble, France
  • 4GIPSA-Lab, Centre National de la Recherche Scientifique, Grenoble, France
  • 5Centre Hospitalier Universitaire (CHU) de Grenoble, Grenoble, France
  • 6Pole Recherche, Centre Hospitalier Universitaire (CHU) Grenoble, Grenoble, France
  • 7IRMaGe, Institut National de la Santé et de la Recherche Médicale US17 Centre National de la Recherche Scientifique UMS 3552, Grenoble, France
Stroke, resulting in focal structural damage, induces changes in brain function at both local and global levels. Following stroke, cerebral networks present structural, and functional reorganization to compensate for the dysfunctioning provoked by the lesion itself and its remote effects. As some recent studies underlined the role of the contralesional hemisphere during recovery, we studied its role in the reorganization of brain function of stroke patients using resting state fMRI and graph theory. We explored this reorganization using the “hub disruption index” (κ), a global index sensitive to the reorganization of nodes within the graph. For a given graph metric, κ of a subject corresponds to the slope of the linear regression model between the mean local network measures of a reference group, and the difference between that reference and the subject under study. In order to translate the use of κ in clinical context, a prerequisite to achieve meaningful results is to investigate the reliability of this index. In a preliminary part, we studied the reliability of κ by computing the intraclass correlation coefficient in a cohort of 100 subjects from the Human Connectome Project. Then, we measured intra-hemispheric κ index in the contralesional hemisphere of 20 subacute stroke patients compared to 20 age-matched healthy controls. Finally, due to the small number of patients, we tested the robustness of our results repeating the experiment 1000 times by bootstrapping on the Human Connectome Project database. Statistical analysis showed a significant reduction of κ for the contralesional hemisphere of right stroke patients compared to healthy controls. Similar results were observed for the right contralesional hemisphere of left stroke patients. We showed that κ, is more reliable than global graph metrics and more sensitive to detect differences between groups of patients as compared to healthy controls. Using new graph metrics as κ allows us to show that stroke induces a network-wide pattern of reorganization in the contralesional hemisphere whatever the side of the lesion. Graph modeling combined with measure of reorganization at the level of large-scale networks can become a useful tool in clinic.

1. Introduction

In numerous neurological conditions, the adult central nervous system retains an impressive capacity to recover and adapt following injury. Such so-called spontaneous recovery occurs after spinal cord injury, traumatic brain injury, and stroke. Therefore, a basic understanding of the mechanisms that underlie spontaneous recovery of function is the initial step in the development of modulatory therapies that may improve recovery rates and endpoints (Nudo, 2013). In acute stroke, it has been shown that initial damage disrupts communication in distributed brain networks. This initial disorganization is followed by a dynamic reorganization at subacute and chronic stage that may determine the level of post-stroke recovery (Carter et al., 2012). Not only disorganization in structural connectivity has been reported and related to outcome of patients (Moulton et al., 2015) but also functional reorganization in the motor network of both ipsilesional and contralesional hemispheres (Loubinoux et al., 2003; Jaillard et al., 2005; Gerloff et al., 2006; Favre et al., 2014) to compensate for the lesion itself and for remote effects (see Grefkes and Fink, 2014 for a review). The role of the contralesional hemisphere in the recovery process after stroke is supported by several studies using task fMRI paradigms (Gerloff et al., 2006; Lotze et al., 2006; Riecker et al., 2010; Rehme et al., 2011; Teki et al., 2013; Grefkes and Fink, 2014) but it has not been studied before as an independent network (without taking into account the interhemispheric connectivity) of the brain. It is thus of clinical interest to study the reorganization of the contralesional hemisphere in stroke patients by means of functional connectivity fMRI at rest.
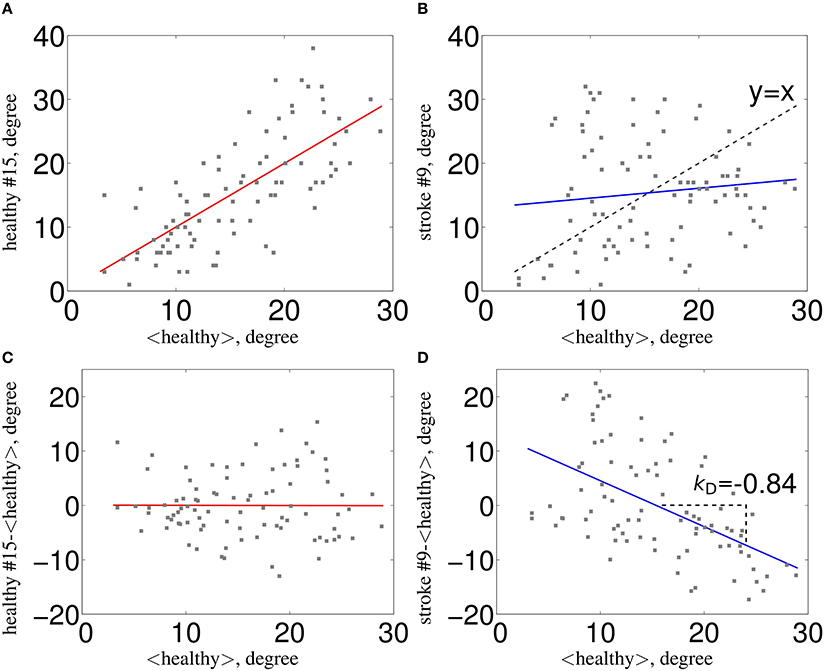
In the recent years, there has been a great amount of work developing new investigation methods of the brain connectivity based on fMRI. Among those, the graph theoretical approach seems particularly useful in the context of pathology since it underlines the role of key communicating regions (hubs) in the graph. Since there was no graph metric aiming at capturing this type of reorganization after brain damage, the Hub Disruption Index (κ) was introduced in Achard et al. (2012) to capture it. κ index summarizes graph metric changes at the nodal level in a single value. It is thus a global index capturing changes at the nodal level. For a given graph metric, κ is computed as the slope of the linear regression model between the mean nodal metric value of a reference group and the differential nodal metric value between a given subject (patient or control) and that reference (see Figure 1 for a graphical explanation). If the subject's nodal values are close to those of the reference group (Figure 1C), the κ will be close to 0. Contrary, if the subject's nodal values are different from those of the reference group (Figure 1D), with reduced values in nodes with high metric values in the reference group, the κ will be negative. Once the reference group is computed, the κ can be calculated for each control and each patient individually and statistical tests can be applied to compare the differences between groups.
FIGURE 1
www.frontiersin.org Figure 1. Estimation of κ. The nodal network topology (here, node degree) of an individual subject in relation to the normative network topology of the healthy control group (A) for one healthy volunteer and (B) for one stroke patient. To construct the hub disruption index κ for the degree, we subtract the healthy group mean nodal degree from the degree of the corresponding node in an individual subject before plotting this individual difference against the healthy group mean. κ is the slope of the regression line computed on this scatter plot. This transformation means that the data for an individual healthy volunteer (C) will be scattered around a horizontal line (κ~0), whereas the data for a patient in a stroke (D) will be scattered around a negatively sloping line (κ < 0).
According to Bullmore and Sporns (2009), hubs are crucial nodes for an efficient communication in the network and are identified as nodes with high degree or high centrality values. In this paper, we computed κ using metrics that directly relate to hubs: node degree, betweenness centrality and global efficiency; and also in metrics that explore the neighborhood of the node, such as, local efficiency and clustering coefficient.
The aim of this paper is to quantify the impact of the lesion on the brain network reorganization of the contralesional hemisphere in severe stroke patients at subacute stage. For this purpose, κ index is a perfect tool to assess such reorganization by comparing nodal metrics between healthy volunteers and patients. In order to translate the use of κ in clinical context, an essential requirement to achieve meaningful results is to investigate the reliability of this index. For this purpose, we used the intraclass correlation coefficient (ICC), as it was previously assessed in several studies working with brain graphs reliability in rs-fMRI (Schwarz and McGonigle, 2011; Wang et al., 2011; Braun et al., 2012; Guo et al., 2012; Liang et al., 2012; Cao et al., 2014).
This paper is divided into three parts: in the first part, we assessed the reliability of κ, over different graph metrics, by computing the ICC in a cohort of 100 healthy subjects using the database from the Human Connectome Project (HCP)1. We calculated the ICCs and their p-values, applying bootstrap and permutation techniques to check for the influence of the number of subjects and of the number of edges (cost) in brain graphs. We also explored whether there is a laterality effect by testing the graphs of the intra-hemispheric connectivity from the left and from the right hemispheres in healthy control subjects using the HCP dataset. In the second part of the paper, we used the κ index to study the reorganization that occurs in the contralesional hemisphere of 20 severe subacute stroke patients. Finally, in the third part, we tested the robustness of the results obtained in this clinical study by randomly choosing 20 subjects as “patients” and 20 subjects as “controls” from the HCP database, computing the difference in κ between them and replicating 1000 times this procedure.

Thursday, July 14, 2016

Contrasting Evolutionary Patterns of Functional Connectivity in Sensorimotor and Cognitive Regions after Stroke

No clue whatsoever. Your doctor will know however and if she doesn't ask her what she actually learned about stroke in medical school.
http://journal.frontiersin.org/article/10.3389/fnbeh.2016.00072/full?utm_source=newsletter&
Huaigui Liu1†, Tian Tian1†, Wen Qin1,2†, Kuncheng Li2 and Chunshui Yu1,2*
  • 1Department of Radiology and Tianjin Key Laboratory of Functional Imaging, Tianjin Medical University General Hospital, Tianjin, China
  • 2Department of Radiology, Xuanwu Hospital of Capital Medical University, Beijing, China
The human brain is a highly connected and integrated system. Local stroke lesions can evoke reorganization in multiple functional networks. However, the temporally-evolving patterns in different functional networks after stroke remain unclear. Here, we aimed to investigate the dynamic evolutionary patterns of functional connectivity density (FCD) and strength (FCS) of the brain after subcortical stroke involving in the motor pathways. Eight male patients with left subcortical infarctions were longitudinally examined at five time points within a year. Voxel-wise FCD analysis was used to identify brain regions with significant dynamic changes. The temporally-evolving patterns in FCD and FCS in these regions were analyzed by a mixed-effects model. Associations between these measures and clinical variables were also explored in stroke patients. Voxel-wise analysis revealed dynamic FCD changes only in the sensorimotor and cognitive regions after stroke. FCD and FCS in the sensorimotor regions decreased initially, as compared to controls, remaining at lower levels for months, and finally returned to normal levels. In contrast, FCD and FCS in the cognitive regions increased initially, remaining at higher levels for months, and finally returned to normal levels. Most of these measures were correlated with patients’ motor scores. These findings suggest a network-specific dynamic functional reorganization after stroke. Besides the sensorimotor regions, the spared cognitive regions may also play an important role in stroke recovery.

Introduction

Motor pathways are frequently impaired in stroke patients with subcortical infarction. In most of these patients, the impaired motor function recovers in the first several months after stroke (Kwakkel et al., 2004), and this recovery has been attributed to a normalization of activity (Ward et al., 2003; Tombari et al., 2004; Kim et al., 2006) and connectivity (Golestani et al., 2013; Rehme and Grefkes, 2013) in the sensorimotor network (SMN). The human brain is composed of multiple highly connected and integrated functional networks. If a network is damaged, other networks may reorganize themselves to facilitate the functional recovery of the damaged network. This hypothesis is supported by findings of increased connectivity in several non-sensorimotor networks in patients with subcortical stroke (Wang et al., 2014). However, the dynamic connectivity changes of non-sensorimotor networks after subcortical stroke remain largely unknown.
In stroke patients, most resting-state functional connectivity studies are based on a priori selection of seed regions (Park et al., 2011; Xu et al., 2014), which cannot provide a full picture of connectivity changes in the whole brain. Moreover, previous studies only focused on functional connectivity strength (FCS) changes between brain regions, leaving post-stroke functional connectivity density (FCD) changes largely unknown. The FCD mapping is a newly developed data-driven method that measures the connectivity density of each voxel (Tomasi and Volkow, 2010). It is a plausible method to identify connectivity changes in the range of the whole brain.
In this study, we adopted a longitudinal design to investigate post-stroke connectivity changes and associations of these changes with motor recovery. First, we performed a voxel-wise FCD analysis to identify brain regions exhibiting longitudinal connectivity changes after subcortical infarctions involving the motor pathways. Second, we investigated post-stroke temporally-evolving patterns in FCD and functional connectivity strength (FCS) in these hub regions. Finally, we explored associations of these altered connectivity properties with clinical outcomes in stroke patients. We hypothesize that some non-SMN regions would also display longitudinal post-stroke connectivity changes based on clues from a cross-sectional study (Wang et al., 2014). We further hypothesize that the SMN and non-SMN regions would exhibit different evolutionary patterns following stroke.

More at link.