- 1Central Laboratory, Renji Hospital, Shanghai Jiao Tong University School of Medicine, Shanghai, China
- 2Department of Neurosurgery, Changzheng Hospital, Navy Medical University, Shanghai, China
- 3Department of Neurology, Southwest Hospital, Army Medical University, Chongqing, China
- 4National Health Commission Key Laboratory
of Diagnosis and Treatment on Brain Functional Diseases, The First
Affiliated Hospital of Chongqing Medical University, Chongqing, China
- 5Department of Neurology, Chinese People's Liberation Army General Hospital, Beijing, China
- 6Neurovascular Imaging Research Core and
University of California Los Angeles Stroke Center, University of
California, Los Angeles, Los Angeles, CA, United States
- 7Department of Anesthesiology, Loma Linda University School of Medicine, Loma Linda, CA, United States
- 8School of Biomedical Engineering, Shanghai Jiao Tong University, Shanghai, China
In acute stroke management, time window has been rigidly used as a
guide for decades and the reperfusion treatment is only available in the
first few limited hours. Recently, imaging-based selection of patients
has successfully expanded the treatment window out to 16 and even 24 h
in the DEFUSE 3 and DAWN trials, respectively. Recent guidelines
recommend the use of imaging techniques to guide therapeutic
decision-making and expanded eligibility in acute ischemic stroke. A
tissue window is proposed to replace the time window and serve as the
surrogate marker for potentially salvageable tissue. This article
reviews the evolution of time window, addresses the advantage of a
tissue window in precision medicine for ischemic stroke, and discusses
both the established and emerging techniques of neuroimaging and their
roles in defining a tissue window. We also emphasize the metabolic
imaging and molecular imaging of brain pathophysiology, and highlight
its potential in patient selection and treatment response prediction in
ischemic stroke.
Introduction
Stroke is the worldwide leading cause of death and adult
disability. More than 80% of all strokes are caused by brain ischemia,
which results from obstruction of one or more cerebral arteries. Rapid
and safe restoration of the blood flow through thrombolysis or/and
thrombectomy is the only approved therapy for ischemic stroke. Such
treatment is strictly limited by a narrow time window and need to be
performed within the first few hours after the onset of symptoms (1, 2).
The “time is brain” mantra has been the golden principle for acute
management of ischemic stroke for decades. Due to the narrow therapeutic
window and strict indications, recanalization therapy is restricted to
only a small fraction (≤ 10%) of stroke patients.
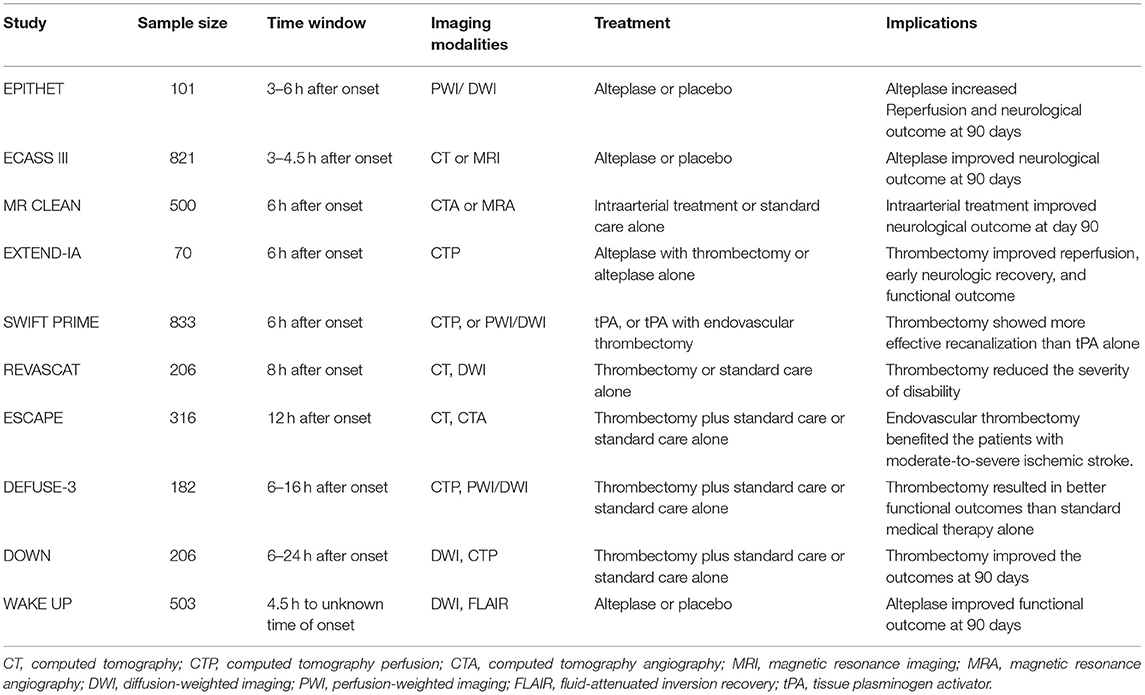
In the past decade, accumulating clinical trials have shown that with
the patients selecting by neuroimaging, the time window for reperfusion
has been iteratively extended (Table 1) (3–6).
The results of these studies revolutionize the field and suggested that
“tissue window” might be more personalized than a “time window” to
guide precision medicine for ischemic stroke (7, 8).
With the rapid development of imaging technology, the ischemic
penumbral tissue is now discernible and quantifiable, which provides the
possibility to detect salvageable tissue and select the eligible
patients for reperfusion therapies (9, 10).
A tissue window defined by neuroimaging can serve as surrogate marker
for brain physiology in ischemic stroke and facilitate therapeutic
decision-making. Here we review the evolution of the time window,
address the advantage of tissue window for clinic manage of ischemic
stroke, and discuss the roles of neuroimaging in defining a tissue
window. We also emphasize metabolic imaging and molecular imaging of
brain pathophysiology, and highlight its potential in patient selection
and treatment response prediction in ischemic stroke.
The Evolution of Time Window For Reperfusion Therapy
The main aim of existing therapies in ischemic stroke is
to restore the blood flow quickly and rescue the potentially
salvageable brain tissue. After ischemic stroke, the injured brain is
characterized by two major zones: the penumbra and the infarct core. The
penumbra is the region around the core that neuronal function is
partially preserved (11).
The fate of penumbral cells critically relies on regional cerebral
blood flow (CBF) and it worsens into infarct core in a time-dependent
manner. If reperfusion is established during the early hours, cells in
penumbra are salvageable (12).
On the contrary, the blood flow in the infarct core declines below to
15–20% of the baseline, this would cause irreversibly damage within the
first few minutes of the stroke onset (13).
Unfortunately, methods of ischemic core imaging, which is currently in
clinical use, are unable to discriminate between incomplete infarction
and pan-necrosis. In order to overcome it and revise the clinically
relevant parameters more accurately, Goyal et al. suggested replacing
the “infarct core” with “ischemic tissue with severity of uncertain
viability (SIT-uv)” (14).
SIT-uv is considered as tissue that is potentially salvageable by
timely reperfusion. Therefore, “time is brain” is still the most
important principle guiding reperfusion therapy since the 1990's (15).
Two primary reperfusion strategies have been
demonstrated effectiveness: intravenous thrombolysis with tissue
plasminogen activator (tPA) and endovascular thrombectomy with stent
retrievers (16).
However, the benefits of both tPA and endovascular thrombectomy are
strongly time-dependent and restricted to only a fraction of stroke
patients due to the narrow time window and strict indications (17, 18). In 1995, tPA was originally recommended to treat ischemic stroke within 3 h of the onset (19).
Until 2008, Hacke et al. suggested that administration of tPA could be
extended to 4.5 h with computed tomographic scan to exclude the patients
with hemorrhage or major infarction (20).
Because of the narrow time window and strict contraindications, only
2–5% of patients present with ischemic stroke received tPA (21).
Recently, guided by perfusion imaging, the window for thrombolysis with
alteplase was extended up to 9 h after onset of stroke (EXTEND trial) (22, 23).
However, the authors had certain doubts that positive results of the
WAKE-up trail nullified the equipoise and terminated the trail early for
this reason (3).
Furthermore, due to the small number of patients (225 patients from 27
hospitals over 8 years) and because 80% of the patients had large vessel
occlusions, the conclusion of EXTEND trail was not reflected in the
current guidelines of American Heart Association (AHA). Still AHA
recommended taking into account the conclusion of WAKE-UP trail, which
stated that patients, who awoke with stroke or had an unclear time of
onset which might be more than 4.5 h of the past (>4.5 h from the
last known well) could be treated with IV alteplase (24).
The eligibility is magnetic resonance imaging (MRI) mismatch between
abnormal signal on diffusion-weighted magnetic resonance imaging (DW-MR)
and no visible signal change on FLAIR. Present guidelines also endorsed
the usage of tenecteplase in patients eligible to mechanical
thrombectomy who do not have contraindications for IV fibrinolysis.
There is emerging evidence for the non-inferiority of tenecteplase
compared to alteplase, although it has not been widely accepted in
clinical practice yet (25).
In 2015, it was proven that mechanic thrombectomy
with/without intravenous thrombolysis can improve functional outcomes
within 6 h after stroke onset (26–28).
In patients who have proximal arterial occlusion and small infarct
core, mechanical thrombectomy can extend the therapeutic window to 8 h
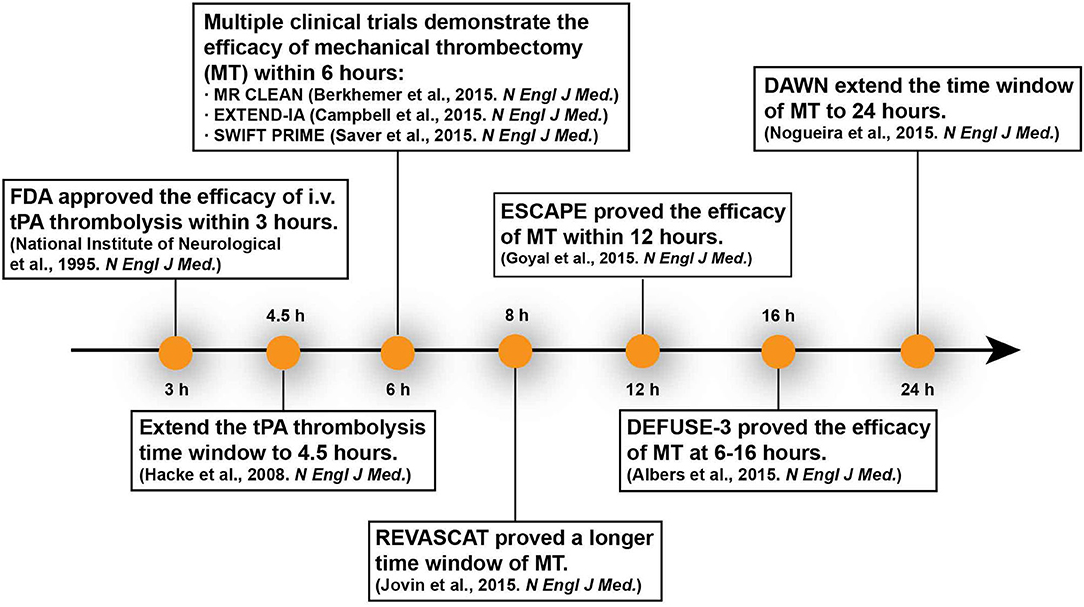
(REVASCAT Trial) even to 12 h (ESCAPE Trial) (29–31). Based on two other recent trials DEFUSE 3 and DAWN, the therapeutic time window can be extended to 24 h since stroke onset (5, 6). Case studies even reported that delayed thrombectomy days or weeks after onset achieved good clinical outcome (32, 33).
Recent animal studies proved that delayed recanalization at 3, 7, or 14
days after permanent middle cerebral artery occlusion (MCAO) led to
better functional and histological recovery (34). These researches represent a new milestone in acute stroke therapy (Figure 1).
Imaging-based patient selection plays a crucial role in the success of
these clinical trials and inspires us to rethink the principle “time is
brain.”
The salvageability of the affected
brain tissue depends primarily on both the duration and the severity of
ischemia. The onset-to-treatment time is not the inflexible determinant
of reperfusion therapy when takes the collateral flow into accounts.
The more extensive the collateral flow, the longer the brain tissue is
tolerant to ischemia. However, the collateral flow is highly variable
among individuals, which results in variation in tissue susceptibility
and therapeutic window. The current “one-size-fit-all” therapeutic time
window does not consider the collateral circulation and varied tissue
susceptibility, and how to evaluate the viability of the ischemic tissue
quickly and accurately is a challenge for the individualized
reperfusion therapy.
Detection of the Penumbra
The penumbra was first experimentally delineated by
Astrup in a baboon MCAO model in 1977. Using somatosensory-evoked
potentials, he defined the penumbra as an area surrounding the ischemic
core in which neurons are affected but have the potential for recovery.
Neurons in this area are characterized by low electric activity but
sustained energy metabolism, and they do not have noticeable
morphological damage (35).
Because of the invasive method, it was difficult to translate this
experimental concept to clinic and improve stroke diagnosis and
treatment. Modern imaging techniques such as positron emission
tomography (PET), MRI, and computerized tomography (CT) can distinguish
salvageable tissue invasively by measuring hemodynamics and energy
metabolism. PET is considered as the “gold standard” for penumbra
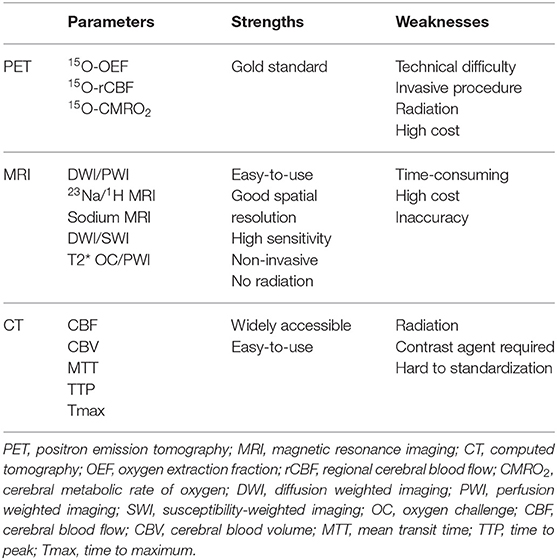
imaging, however, MRI is more favorable in practice. In addition, CT
perfusion is being increasingly used for its low cost and wide
availability. The strengths and weaknesses of these imaging modalities
on penumbra identification are summarized in Table 2.
PET
The existence of penumbra in stroke patients was
demonstrated for the first time by PET. In 1981, Baron et al. observed
decreased CBF and increased oxygen extraction fraction (OEF) in an
ischemic stroke patient by PET and coined this modality as “misery
perfusion” which indicated potential viable tissue (36). This area with increased OEF was the original definition of penumbra. Labeling arterial blood sample with 15O allows PET to assess the regional CBF, OEF and cerebral metabolic rate of oxygen (CMRO2) (CMRO2
= CBF × OEF × arterial oxygen content) and determine the penumbra.
Early PET studies classified the ischemic tissue into 3 regions
depending on CBF rate: the infarct core with CBF <12 ml/100 g·min,
the penumbra with CBF of 12–22 ml/100 g·min and the oligemia with CBF
>22 ml/100 g·min (37–40).
In practical applications, the extent of penumbra is dynamic and time
dependent process, which varies with the severity and duration of
ischemia. CBF value only reflects the reperfusion status at the time of
imaging. An initial severe ischemia may show a normal appearing CBF
value because of partial restoration of blood flow, but the ischemic
tissue has already irreversibly damaged (37, 41). The advanced 15O-O2
PET can detect OEF and distinguish viable tissue from core infarction.
Thus, the mismatch between CBF and oxygen metabolism is usually
considered as the in vivo hallmark of penumbra region, which maintains transient oxygen supply while suffering severe hypoperfusion (40, 42). Recently, some advanced approaches have been used to identify the penumbra. 11C-flumazenil (11C FMZ), a marker of cortical neuron integrity, combine with 15O-H2O
PET can detect early neuronal death irrespective of time elapse and
without arterial blood sampling. Based on the specific metabolic
parameters, it is well-accepted that PET is the gold standard for
determining the penumbra (43, 44).
However, detection of penumbra by PET has several
limitations, such as technical difficulty, invasive procedures, exposure
to radioactivity and high cost, which prevent PET from broad acceptance
in clinical routine (44). Therefore, both improvement of current methods and the development of other imaging modalities are needed.
MRI
Compare to PET, MRI has better spatial and temporal
resolution, and no risk of radiation exposure of patients. MRI has
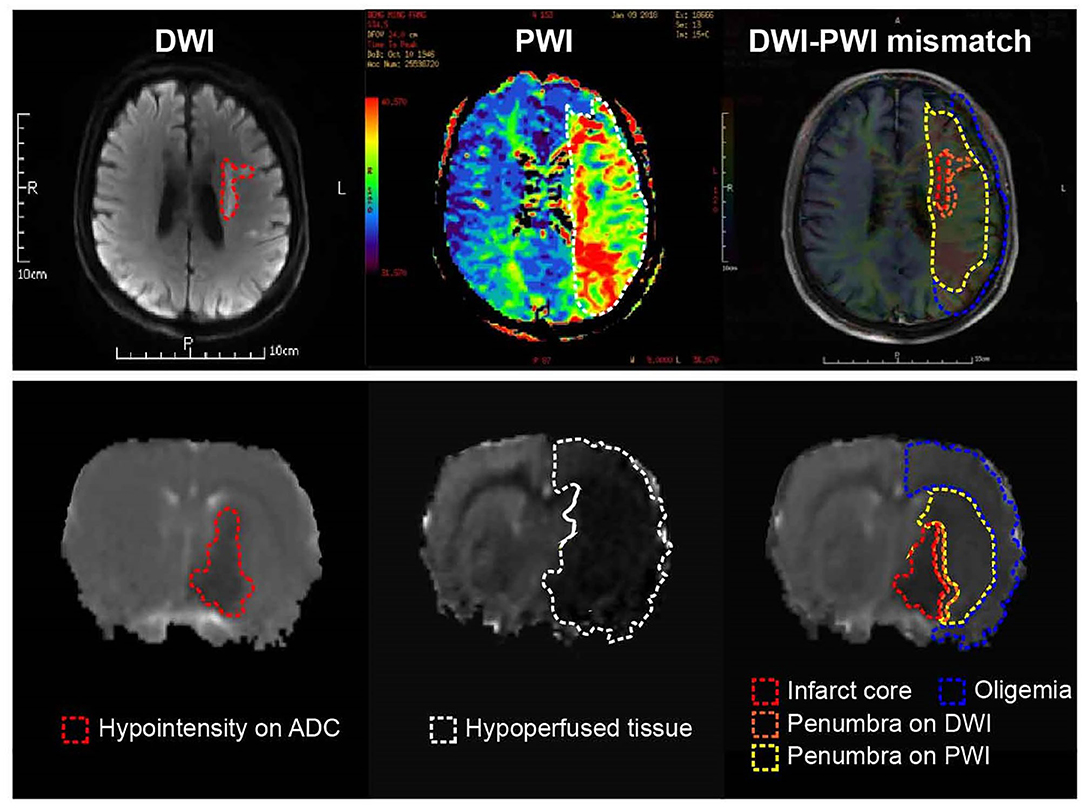
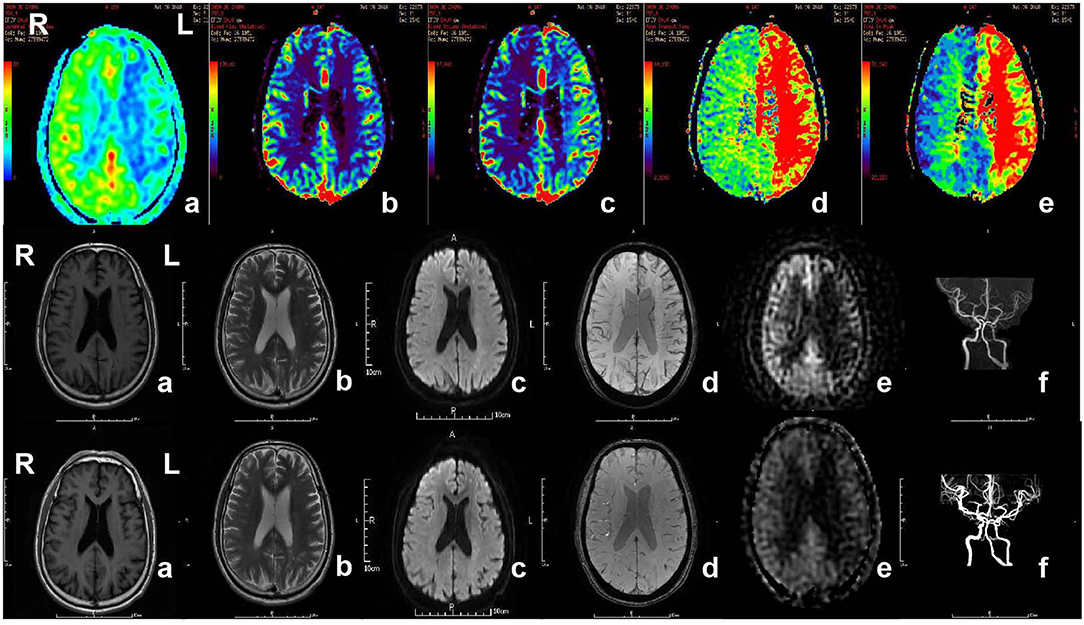
largely replaced PET in acute stroke imaging in clinic (45). The MRI-based perfusion-diffusion mismatch (PDM) is a surrogate of PET-based penumbra evaluation (Figure 2).
Diffusion weighted imaging (DWI) refers to the visualization of random
Brownian movement of water molecules in brain tissue. Lower diffusion
coefficients generally resulted from energy failure and subsequent
cytotoxic edema, and it is suggested to delineate infarct core tissue
that irreversibly damaged (Figure 3) (46).
Perfusion weighted imaging (PWI) measures brain perfusion dynamically
with such parameters as CBF, cerebral blood volume (CBV), mean transit
time (MTT) and time to peak (TTP) (Figure 3) (47).
PWI abnormality provides the information on both infarct core and the
surrounding hypoperfused tissue. Volumetric-based PDM is usually defined
as a mismatch ratio of PWI/DWI ≥1.2, which is postulated to represent
the penumbra that locates outside the infarct core but is at risk of
infarction (48). The concept of PDM has been proved practically in both experimental and clinical studies (49–51). Early clinic studies have shown that salvage of brain tissue delineated by the PDM improved neurological functions (52, 53),
and selection of patients with PDM increased the rate of reperfusion
and achieved favorable clinical response when treated within 6 h (54, 55). However, this surrogate marker of penumbra is challenged by several limitations (44).
Comparative PET/MRI studies confirmed the mismatch area imprecisely
depicts elevated OEF and overestimated the penumbra from benign oligemia
defined by PET. Because of the wide variation in thresholds, DWI also
overestimates the infarct core by including part of the penumbra (56–58).
And as the viability and metabolic state of brain tissue strongly
depends on the duration of ischemia, for those “wake-up” patients who
didn't know stroke onset time (SOT), it is hard to set threshold of the
parameters [such as TTP and time to maximum (Tmax)] (57).
Accumulating evidence has shown that there was no clear association between PDM and penumbra (59–62),
and the inaccuracy of PDM in defining penumbra may be responsible for
the failure of some reperfusion and neuroprotection therapies in clinic (63, 64).
It is urgent to develop novel imaging paradigms that can serve as a
clinical marker of penumbra. Several attempts have been made to improve
the accuracy of PDM in penumbra predicting. Combined 23Na-MRI to 1H-MRI
was developed to complement PDM and serve as a viability marker for
penumbra detection in several animal models. Tissue sodium concentration
increased in the core and decreased in the penumbra so that the viable
penumbra could be differentiated from the core in transient MCAO rats (65, 66). In addition, it has been proposed that sodium MRI may help determine the SOT by calculating this retrospectively (67, 68).
Susceptibility-weighted imaging (SWI) is also used to identify the
penumbra in stroke patients. SWI detects the paramagnetic susceptibility
difference between deoxygenated and oxygenated hemoglobin, which
reflects the OEF of brain tissue (69). DWI-SWI mismatch is shown to be a promising marker for evaluating penumbra (70). In addition, by mapping the ratio changes of deoxyhemoglobin/oxyhemoglobin, T∗2
oxygen challenge combined PWI assessed the viability of penumbra
serially and showed advantages over PDM for penumbra detection (71).
Computed Tomography Perfusion (CTP)
CTP is an imaging technique that is increasingly used for
determination of infarct core and penumbra in acute ischemic stroke
patients. The clear advantages of this technique are its easily
accessibility and fast acquisition (72).
Similar to PWI MRI, raw data of CTP is also displayed in parameter
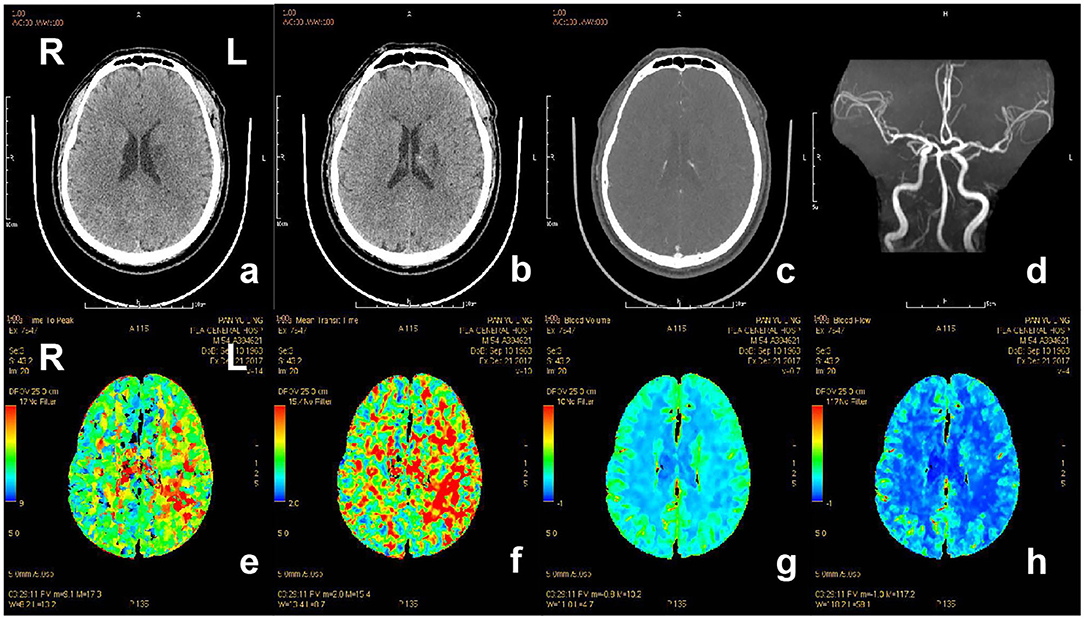
maps, including CBF, CBV, MMT, TTP, and Tmax. Regions with dramatically
reduced CBF or CBV correspond to the core infarction, while regions with
prolonged MTT, TTP, or Tmax delineate the penumbra (Figure 4) (73).
However, there is significant variability in CTP technique between
different CT scanners, processing software and prior institutional
optimization, and this results in controversy about the accurate
measurement of penumbra (74).
Moreover, due to the delay of the arrival of contrast to brain, CBV
calculation always results in an overestimation of the core lesion that
leads to an underestimation of penumbra (75). CTP still has the risk of radiation exposure and toxicity of the contrast agent.
Metabolic Imaging of Ischmeic Stroke
For patients excluded from reperfusion therapy due to
exit of the therapeutic time window established by imaging strategy
mentioned above, there is another opportunity to expand the treatable
population: selecting of the patients by advanced physiologic imaging.
Both MRI-based PDM and CTP depend on selecting threshold values of blood
flow to differentiate the penumbra from infarct core and benign
oligemic brain tissue. And these thresholds change with the evolution of
stroke. So far, there are no validated thresholds that accepted for
routine penumbra imaging in the clinical setting. Parameters which
display the physiology of brain immediately and independently of the
onset-time are in urgent need to delineate penumbra accurately and guide
the precision therapy in stroke. When the blood flow is compromised,
energy metabolism disturbance occurs within seconds as brain has very
limited supply of energy producing substances and relies on oxidative
metabolism to meet its tremendous energy requirements (76, 77).
The metabolic stress induces ionic perturbations and oxidative stress
which trigger the cascade of pathophysiological events ultimately
resulting in neuronal death (78).
Accumulating evidence has suggested that energy status is associated
with cell survival and determines the fate of ischemic tissue (79–81).
Direct measurement of the metabolic status provides more accurate
information to delineate the viable tissue. Therefore, energy metabolism
can serve as a direct indicator of the salvageable tissue in the
penumbra zone. Quantification of cerebral oxygen metabolism has shown
great promise in revealing the viability of ischemic tissue during
stroke. Several imaging modalities, such as PET and MRI, have been
applied to image cerebral oxygen metabolism in both experimental
research as well as clinical practice (82). These imaging methods and parameters they can detect are summarized in Table 3.
Furthermore, we review the most recently advances in metabolic imaging,
which may greatly facilitate routine clinical applications to guide
optimal therapy decision for acute ischemic stroke as well as subacute
or chronic stroke with permanent large vessel occlusion.
PET Metabolic Imaging
As mentioned above, 15O multi-tracer PET can
provide the tomographic distributed imaging of brain oxygen extraction
and metabolism. More importantly, it is the reference standard for
quantitative evaluations of OEF, CMRO2, CBV, and CBF. In the
late 1970's, scientists successfully measured the regional brain CBV and
CBF, and oxygen metabolism in stroke patients with 15O-labeled PET, and distinguished the severely hypoperfused but potentially salvageable tissue from the irreversibly damaged (83–85). Using 15O-H2O PET, Heiss et al. found that the misery perfused tissue was salvaged by early intravenous thrombolysis (86).
This study is a millstone in stroke research. It revolutionized the
management of acute stroke patients by demonstrating the positive result
of rt-PA. However, due to the technical complexity, 15O PET
is not widely performed in clinical settings, with issues involving
requirement of on-site cyclotron and radiochemistry facility because of
the short half-life of 15O (2 min), real-time artery blood sampling and analyzing to obtain the regional CBF (rCBF), as well as complex post processing (87). Efforts have been made to streamline the 15O-PET
examination for routine clinical practice, including: (i) quantitative
voxel-by-voxel maps of rCBF without a direct arterial input function (88); (ii) shortening the clinical examination period by dual-tracer (H152
O and 15O2) autoradiography approach (89); and (iii) developing non-invasive techniques to assess CBF, OEF, and CMRO2 (90).
Attempts were also made in animal stroke studies. Methodological
inventions, such as intravenous administration of injectable 15O2 and inhalation of 15O2 gas, had been tried to facilitate the evaluation of CMRO2 and OEF in small animals (91–93).
These developments potentiate the possibility of using PET in clinical
routine to expand the treatable stroke patients in early stage.
The improvement of the radiotracers has revolutionized the use of PET in measuring OEF and CMRO2
and mapping the cerebrovascular reserve and the penumbra. The newly
developed PET ligands, including radio-labeled FMZ, radio-labeled
fluoromisonidazole (FMISO), and copper-based radiopharmaceuticals
(Cu-ATSM) have been explored to delineate the disease in preclinical and
clinical research. In 1997, 11C-FMZ PET was used to indicate
the development of infarction in cat stroke model and showed the
potential to select eligible patients for early therapeutic intervention
(94).
In 2000, a clinical trial proved that 11C-FMZ PET was able to
differentiate the viable tissue from the irreversibly damaged at the
early stage of acute stroke (95). In this study, the areas with reduced perfusion but preserved 11C-FMZ binding could benefit from reperfusion therapy, while the areas with 11C-FMZ uptake defects were permanent lesions. Thiel et al. reported that 11C-FMZ PET could be used to estimate rCBF in ischemia without arterial input function (96). However, the application of 11C-FMZ PET in clinical practice is limited by several issues: the requirement of cyclotron to produce 11C, the regional expression of benzodiazepine receptors in cerebral cortex, and the low affinity of 11C-FMZ to bind with its receptor at the acute phase of ischemia/reperfusion (97). New PET tracers are still in urgent need to meet the clinical requirements.
Compared with11C-FMZ PET, 18F-FMISO PET is more broadly used (98). In a preclinical study, 18F-FMISO microPET was used to map the brain hypoxia in the acute stage of permanent distal MCAO rats, and supported that 18F-FMISO might be a marker of core area as well as of penumbra (99). Besides, 18F-FMISO uptake was also used to predict the tissue fate. The patients without 18F-FMISO uptake had no infarct growth on the follow-up DWI, while those with abnormally increased 18F-FMISO uptake showed grown infarct (100). And white matter was reported to take up more 18F-FMISO than gray matter, indicating stronger resistance to ischemia than gray matter (101). However, the penumbra outlined with 18F-FMISO may be overestimated. When using 18F-FMISO
in ischemic stroke patients, large regions of hypoxic tissue was found
surrounding the ischemic core, which spontaneously reverted back to
normal (102). The major drawback of 18F-FMISO PET is the slow kinetics of 18F-FMISO,
which requires 2–3 h to clear it from the hypoxic tissue. A faster
kinetic and metabolic rate tracer is needed for metabolic imaging.
Compared with nitroimidazole, Cu-ATSM is rapidly washed out, and the
imaging can be finished with 20–30 min after injection (103). Cu-ATSM has also been proved to modulate inflammation and has therapeutic potential in experimental stroke (104).
MRI Metabolic Imaging
Studies have investigated MR-based PWI and DWI, and suggested the PWI-DWI mismatch regions as potentially salvageable tissue (51).
This clinical routine protocol does not define metabolic activity
directly; however, PWI and DWI clearly indicate different metabolic
regions. The following sections will carefully discuss related major MRI
metabolic imaging techniques, which have been summarized in Table 2.
Magnetic Resonance Spectroscopy
MRS acquires the signal arising from brain metabolites
by analyzing molecules such as hydrogen ions or protons. Because of high
spatial and temporal resolution, proton MRS (1H MRS) is the
more commonly used. The most assessed metabolites with potential value
for clinical stroke evaluation are lactate (1.30 ppm) and tNAA (2.02
ppm) (105–107).
Preclinical studies have shown that levels of total N-acetylaspartate
(tNAA) decrease to 50% in the first 6 h after ischemic stroke, followed
by a milder decrease to 20% for the subsequent 24 h, and gradually
returned to 30% until 7 day (107). Clinically, the concentration of tNAA in penumbra and in core infarction may even decrease below the level of detection (108, 109). Severely decreased tNAA is related to serious clinical syndrome and extensive infarction, which means poor clinical outcome (110).
Lactate is the end product of anaerobic glycolysis and rises within
minutes after ischemic stroke. Elevated lactate in the core of ischemic
tissue is positively related to the final infarct size and neurological
deficits (111). The increase of lactate accompanied with reduction of tNAA was observed in patients with large infarction and poor outcome (110).
Therefore, the level of lactate and tNAA is important for evaluating
the severity of stroke and predicting the recurrence of ischemic events (112).
Interestingly, a recent MRS stroke animal study suggested that ML3
(bis-alyllic protons of polyunsaturated fatty acids, 2.80 ppm), which
was detected of a significant increase at 7 days after stroke, may be a
non-invasive surrogate biomarker of cumulative apoptosis in stroke,
which could be used as a clinical predictive marker (107).
13P MRS is also used to evaluate brain energy
metabolism in ischemic stroke by assessing the high energy phosphate
metabolism, particularly adenosine triphosphate (ATP) and creatine
phosphate (PCr) (113). A gradual decrease in ATP was only exhibited in severe stroke, not mild stroke (114). The ratio of PCr to inorganic phosphate (Pi) (PCr/Pi) showed a precipitous decrease during ischemia as well as reperfusion (114). Cerebral intracellular pH can also be measured by 13P MRS. It was calculated by the chemical shift (δ) of the Pi resonance peak relative to the PCr resonance peak (115).
Though MRS is of great value in assessing the severity of
ischemia and predicting the risk for recurrence, low signal-noise
ratio, long sequence duration and the risk of lipid contamination make
MRS not suitable for routine assessment of acute ischemic stroke
patients.
Oxygen Challenge Imaging
Oxygen challenge imaging (OCI) is based on blood oxygen
level-dependent (BOLD) contrast MRI that reflects the changes in blood
oxygen saturation. OCI uses transient hyperoxia during T∗2
-weighted
MRI to present dynamic changes in deoxyhemoglobin concentration.
Therefore, tissues in the penumbra exhibit an increase in
T∗2 signal intensity, with diminished or absent
T∗2
signal intensity in the infarct core. Time to peak value from OCI
offers additional information to facilitate the identification of
at-risk tissue in ischemic stroke rats (
116). The region of OCI response was reported to be larger than the PWI-DWI mismatch region (
117). The
T∗2
OCI was developed using 100% normobaric hyperoxia and has showed
clinical translational potential for stroke diagnosis. However, inhaled
100% oxygen induces sinus artifacts in the front lobe. Decreasing the
concentration of inhaled oxygen can decrease these artifacts, but makes
more difficult to distinguish the penumbra from surrounding tissues (
117).
Recently, the combination of 40% oxygen and perfluorocarbons and
fluorinated hydrocarbons with respiratory gas significantly enhanced
T∗2 response to 40% oxygen in
T∗2 defined penumbra (
118). The same group also developed the GOLD (Glasgow Oxygen Level Dependent) diagnostic imaging method by using
T∗2oxygen challenge (
T∗2OC, 100% inhaled oxygen) combined with lactate change MRS technique (119).
This method worked concurrently to identify the salvageable tissue in
penumbra based on the glucose metabolic status in MCAO rats. However,
the disadvantages of OCI are, as mentioned above, the poor
signal-to-noise due to the limited oxygen that delivered to the tissues
and the artifacts caused by the paramagnetic effect of 100% O2 within the paranasal sinuses (120).
pH-Weighted Imaging
Zhou et al. developed a new MRI approach which was predominantly sensitive to the intracellular pH changes (121).
This method benefited from the chemical exchange processes, which amide
protons transfer between cellular peptides and proteins in a
pH-dependent manner. Because amide proton transfer (APT) is pH
dependent, measures of APT may be used to measure pH value (122).
Acute ischemic stroke causes an accumulation of lactic acid and results
in the decrease of pH, which could be the earliest sign for the tissue
at risk. Accordingly, there were research data which suggested that pH
imaging could be used to define the ischemic penumbra. The hypoperfused
tissue with normal ADC and low pH may represent ischemic penumbra (121, 123, 124).
A further study suggested that an additional pH-weighted imaging with
PWI-DWI was superior to PWI-DWI alone to predict the tissue outcome in
ischemic stroke rats (125).
Although most early studies, which investigated
pH-weighted imaging technique, were performed in rodents, there is
increasing translation of this technique to human studies. Tietze et
al., for the first time, demonstrated that clinical application of
pH-weighted imaging in acute stroke patients was possible and could be
quantified, which carried potential for providing additional information
on metabolic changes in acute ischemia (126).
Subsequently, scientists from Oxford successfully identified the
ischemic penumbra using pH-weighted magnetic resonance imaging (127).
Although studies related to pH-weighted imaging have
provided important insights in the pathology of acute stroke, they
currently cannot be applied in clinical routine due to their technical
limitations, such as hardware constraints of human MRI scanner (short
repetition time and strong radio-frequency saturation power),
acquisition protocols selection (single-slice or volumetric APT imaging)
and analyzing techniques (128).
Consequently, pH-weighted imaging studies have paid more attention to
develop better quantifying approaches and improve the APT MRI
sensitivity to pH, thus, the acidosis in ischemic penumbra can be more
reliably delineated (128–130).
Other Mmetabolic Imaging Techniques
There are many other imaging modalities that are at early stage of ischemic metabolic imaging, such as sodium imaging, PET 17O imaging, and MR-derived cerebral metabolic oxygen index (MR COMI) (131).
While metabolic imaging is promising, emerging imaging technologies
require considerable validation to consider how they fit into the
current imaging protocols and what information they accurately provide
to guide the recanalization therapy. Many of these techniques will
require technical refinement before they can be used in clinical acute
ischemic stroke.
Molecular Imaging of Pathophysiology
Ischemia causes the shortage of glucose and oxygen and
subsequently depletion of ATP, which result in the dysfunction of
sodium-potassium pump and membrane depolarization (132).
That induces multiple pathophysiological cascades, including
excitotoxicity, apoptosis, acidosis, blood-brain barrier (BBB) leakage,
and immune response, which lead to ischemic neuronal loss (133).
Several imaging techniques have been used in the visualization of ischemic stroke pathophysiology (134). For example, ischemia results in marked reduction of tissue pH that triggers neuronal death (135).
As mentioned above, pH-weighted MRI can detect the changes of tissue pH
value that reflect the progress of acidotoxicity. MRS can evaluate
tissue levels of lactate and ML3 that on this way estimate the status of
acidosis and apoptosis. Current developments of pathophysiology imaging
facilitate the in vivo assessment of pathophysiological markers
and therapeutic targets after stroke, and provide the opportunities for
the translation of multimodal imaging strategies in stroke diagnosis and
treatment. The pathophysiological parameters that can be detected are
summarized in Table 2.
Visualization of Excitotoxicity
Excitotoxicity caused by excessive release of glutamate
is one of the major culprits that responsible for the neuronal death and
neurological deficits after stroke. The levels of glutamate can be
detected by 1H MRS. In MCAO model in rats, Ramos-Cabrer et
al. demonstrated that the levels of glutamate increase in center of the
infarction core and then spread to the peri-infarction. Within 24 h
after stroke, glutamate levels decreased significantly in the infarct
core area, whereas regular levels were detected in the periphery of the
core lesion (136).
A clinical research found the differences of glutamate levels between
infarct core and reperfused ischemic penumbra. In the ischemic stroke
patients who received intravenous tPA within 4.5 h, high glutamate
concentrations in peri-infarct were observed in the hyperperfused
patients, while glutamate concentrations were low in the
non-hyperperfused patients (137).
The evaluation of glutamate depends on the magnetic field strengths. At
low magnetic field scanner, the peak of glutamate and glutamine are
consecutive that cannot distinguish glutamate from glutamine. At field
strengths of 3.0 T or higher, the separation of glutamate and glutamine
is feasible. Besides, 1H MRS technique requires long acquisition times and has low spatial resolution.
Recently, a new MRI technique for imaging glutamate has
been developed based on chemical exchange saturation transfer (CEST)
effect. The CEST effects of amide and hydroxyl protons have also been
used to measure pH value changes after ischemic stroke. It has been
demonstrated that middle cerebral artery occlusion (MCAO) induced about
100% elevation of glutamate CEST (GluCEST) in the ischemic tissue
compared with the contralateral side in rats. This method images the
relative changes of glutamate and has the advantages of high spatial and
temporal resolution. However, GluCEST imaging is only achievable in the
human brain in ultrahigh field (7.0 T) and is not currently accessible
in the clinic (138).
Monitoring the Neuroinflammation and Immune System
The immune system plays a pivotal role in the response to ischemia and the eventual recovery of function (139).
The complex cascade of immune cells and inflammatory factors contribute
to the breakdown of BBB. After stroke, microglia immediately respond to
the ischemic insult, followed by the proliferation of macrophages,
dendritic cells, and lymphocytes. With the occurrence of BBB breakdown,
neutrophilic cells permeate the infarct and peri-infarct region. The
immune cells release excessive pro-inflammatory cytokines (i.e., TNF-α
and IL-1β) and produce large amounts of free radicals, which contribute
to the upregulation of cell adhesion molecule and further propagate the
inflammatory response (133).
Additionally, inflammation elevates production of matrix
metalloproteins (MMPs) and myeloperoxidase, both of which are major
factors leading to BBB breakdown.
After ischemic stroke, the spatiotemporal profile of
neuroinflammation with cellular and molecular MRI has been increasingly
explored. In cellular and molecular MRI, paramagnetic contrast agents
such as gadolinium chelates and small particles of iron oxide were used
to detect specific leukocyte populations or molecular inflammatory
markers after stroke. Several pre-clinical and clinical studies have
demonstrated the application of contrast agents to image the monocyte
infiltration after ischemic stroke. The most common strategy for
labeling circulating monocytes is the administration of iron oxide
nanoparticles. For the labeling, two kinds of particles can be used:
small and ultrasmall superparamagnetic iron oxide particles (SPIO and
USPIO, respectively) (140–144). SPIO and USPIO shorten the transverse relaxation times T2 and T∗2
, and the cells taken up SPIO or USPIO present hypointense on T
2 or
T∗2-weighted
images. Rausch et al. found that USPIOs distributed in patches within
the lesion and surrounding area on the first 2 days. On day 4, USPIOs
expanded within the lesion core. On day 7 they were found predominantly
within the boundary area. This strategy has been used in some human
studies to detect macrophage activity in stroke patients (140, 141). With the target-specific contrast agents, molecular MRI have shown the potential to examine inflammation markers in vivo
in experimental stroke. Jin et al. designed a magnetic
nanoparticle-P-selectin binding peptide (MNP-PBP) to image endothelial
P-selectin and E-selectin. MNP-PBP showed a notably greater T2 effect in the infarction and had a tighter binding affinity with selectin (145, 146).
Vascular cell adhesion molecule (VCAM-1) and MMPs are other targets for
neuroinflammation imaging. In a pre-clinical study, researchers
developed microparticles of iron-oxide (MPIO), an MRI contrast agent
that could bind with VCAM-1 on the cerebral vascular endothelium and
visualize the expression of VCAM-1 (147).
The result showed the spatial extent of VCAM-1 was considerably larger
than the lesion core area measured by DWI MRI. The authors thought that
this molecular MRI imaging of VCAM-1 might include both ischemic core
and potentially salvageable penumbral regions.
Microglial activation can be monitored by PET imaging
with related molecular biomarkers. The 18 kDa translocator protein
(TSPO) system is the most commonly used target system for
neuroinflammatory imaging. Due to the activation of microglia, the TSPO
density is elevated after ischemic stroke. Furthermore, it has been
demonstrated that using [11C] vinpocetine, a prospective
radio ligand of TSPO, the regional changes of TSPO can be measured in
the brain of ischemic stroke patients (148). The elevated level of TSPO which indicated the activated microglia was found both in the ischemic core and peri-infarct area.
As far as imaging modalities concern there are only a few
options, which allow do discriminate different cell types in the
infarcted tissue of patients. Molecular MRI has shown promising futures
regarding monitoring of inflammatory cells such as neutrophils,
leukocytes and microglia, but it is unable to provide the information in
regards of cell viability. Futhermore, the molecular MRI is currently
not highly specific and the interpretation of obtained results is
sometimes challenging. The toxicity of contrast agents is another
concern. All these shortcomings complicate the clinical implementation
of this imaging technique.
Imaging Blood-Brain Barrier Leakage
Restoration of blood flow can induce reperfusion injury,
reperfusion injury is one of the events that compromises the BBB. The
leakage of BBB, which has been reported have a biphasic pattern, can
cause severe brain edema and hemorrhagic transformation (149, 150).
MRI and CT are the most widely used clinical imaging tools to evaluate
BBB disruption by detecting the extravasation of the intravenously
administered small molecular weight contrast agents (151).
Dynamic contrast-enhanced MRI (DCE-MRI) is considered as the gold standard MRI approach to evaluate BBB permeability (152).
Gadolinium-diethylenetriamine penta-acetic acid and its variant
gadolinium-diethylenetriamine penta-acetic acid-bis (methylamide) are
the most used contrast agents that are given as intravenous bolus
injection. The accumulation of contrast agents in the extracellular
matrix of ischemic tissues results in increased longitudinal relaxation
rate and hyperintensity in T1-weighted MRI. DCE-MRI exploits this T1 enhancement to extract quantitative or semi-quantitative information regarding BBB integrity (153).
Several pre-clinical studies using DCE-MRI assessed BBB integrity after
ischemic stroke. The results consistently have shown a biphasic pattern
of BBB permeability after ischemic stroke. Compared to sham-operated
animals, the BBB permeability on ipsilateral striatum increased at 4 h
after the onset of ischemic stroke. Compared to the 4 h value, a
significant decline of stroke-induced BBB disruption was observed at 24
h. Another rise of BBB permeability followed at 48 h. At this time
point, the BBB disruption was more prominent than at both 4 and at 24 h
after stroke induction (154).
The mechanisms of this partial recovery in BBB function are not
completely understood. Besides, biphasic pattern of BBB permeability has
not been categorically confirmed in stroke patients.
CT can also be used to evaluate BBB integrity. Similar
with DCE-MRI, DCE-CT involves intravenous injection of an iodinated
contrast agent and voxel-wise measurement of attenuation coefficient as a
function of time (155).
In the clinical setting, the accessibility and the fast scanning speed
of CT makes it the first choice for making treatment decisions for
ischemic stroke. BBB disruption can potentially be assessed by
incorporating a DCE-CT protocol into the initial CT imaging of a
patient. Recently, Park et al. developed a new in vivo micro-CT
which uses iopromide to visualize the leakage of BBB. The new micro-CT
BBB imaging technique has a high resolution and sensitivity (156).
Although some other imaging techniques (such as PET and
optical imaging) have been also used to evaluate BBB permeability, their
limitations, such as low resolution and inter-rater reliability,
restrict their application in the clinic setting (157, 158).
Conclusions and Perspective
Reperfusion therapies are critically time dependent. The
earlier treatment within time windows leads to more benefits. For the
patients reached beyond the time windows, “tissue window” should be
considered. Emerging evidence from recent clinical trials have
recognized that tissue viability defined by the imaging modalities might
be a more precise and reliable surrogate marker than time window (159).
The newly issued guidelines have recommended evaluation of the penumbra
or infarction by DWI, PWI, and CTP to expand eligibility for mechanical
thrombectomy in the 6–24 h window after stroke onset. Compared to PDM,
the novel imaging features on metabolism and pathophysiology, are more
specific and sensitive to examine the salvageable tissue after stroke,
and show great potential to define the therapeutic window. However,
there are still challenges and controversies. Nonetheless, it needs to
be said, that there is no reliable setting to determine the viability of
brain tissue in the acute stage of stroke. Although visibility of such
imaging setting as oxygen challenge MRI and DCE-MRI/CT for the detection
of BBB leakage were tested in rodent studies, their usefulness for
clinic have not been evaluated yet. Others, such as pH-weighted imaging
and glutamate imaging, have only been validated in human studies, but
all the same the utility of the concepts have not been evaluated in
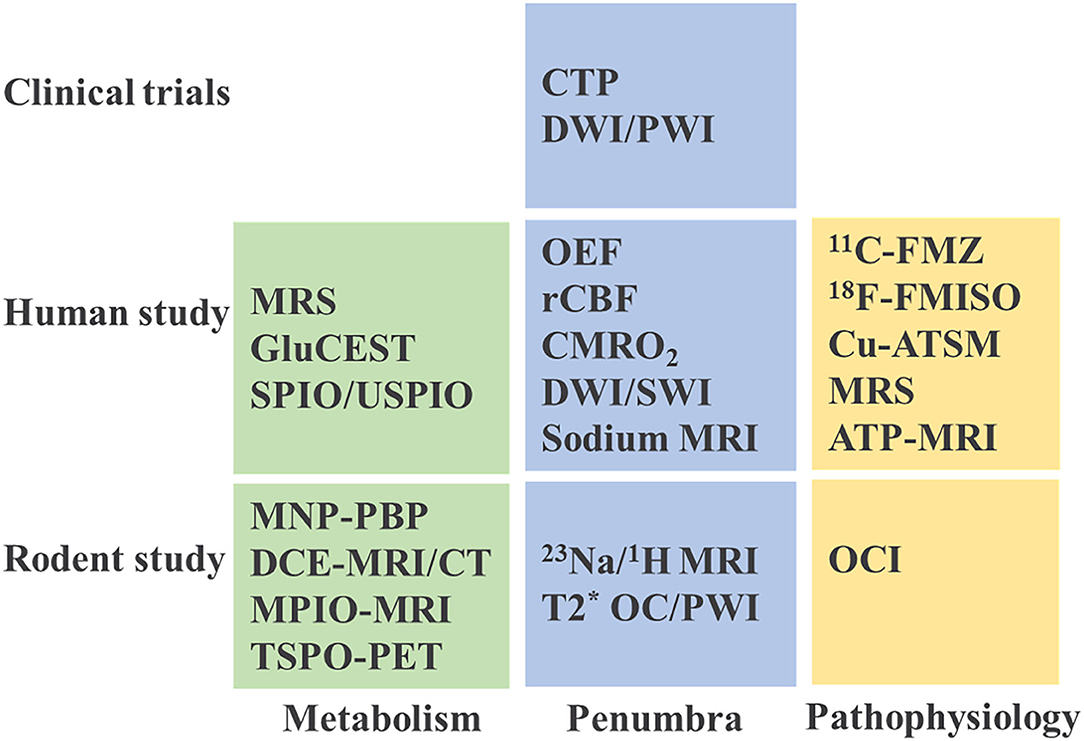
clinical trials yet (Figure 5).
Though PDM tempts us to differentiate the potential salvageable tissue
from infarction, unfortunately, the ideal imaging parameters and their
accuracy remain elusive. Definitive validation is necessary in the
future research and clinical trials. And because of a lack of
standardization, the incorporation of the imaging modalities in clinical
practice will be consequently limited. Future investigations on
standardization of the imaging sequences and parameters to define tissue
window are expected. Besides, the restricted attainability and long
time needed for examination are burdens that limit PDM application for
stroke patients. For instance, in Europe on average only 4% of the
decision in regards of possible treatment will be based on MR perfusion
and this number varied greatly from country to country (160).
The time needed for an MRI perfusion scan is ~16 min. That is longer
than 10 min, which are needed for CTP. However, it is possible to
standardized stroke MRI protocols and reduce time in this way down to 10
min or even to 6 min by using echo planar imaging at 3 T (161).
It is clear that with increased availability and standardization of the
parameters, PDM could become the prime imaging technique able to
precisely define the tissue window and identify patients eligible for
endovascular thrombectomy.
OC/PWI,
T∗2
Author Contributions
JL, QH, YL, and XH wrote the manuscript. DL and JZ made
suggestions for improvement. QM and LZ created the figures. AM edited
the language. All authors read, revised, and approved the final
manuscript.
Funding
This research was supported by the National Natural
Science Foundation of China No. 82071283 to QH, China Postdoctoral
Science Foundation Grant No. 2018M632130 to JL, and the National
Institutes of Health P01 NS082124 to JZ.
Conflict of Interest
The authors declare that the research was conducted in
the absence of any commercial or financial relationships that could be
construed as a potential conflict of interest.
Publisher's Note
All claims expressed in this article are solely those of
the authors and do not necessarily represent those of their affiliated
organizations, or those of the publisher, the editors and the reviewers.
Any product that may be evaluated in this article, or claim that may be
made by its manufacturer, is not guaranteed or endorsed by the
publisher.


 Jianfei Lu
 Qiyong Mei
 Xianhua Hou
 Anatol Manaenko
 Lili Zhou
 David S. Liebeskind
 John H. Zhang
 Yao Li
 Qin Hu