Use the labels in the right column to find what you want. Or you can go thru them one by one, there are only 34,358 posts. Searching is done in the search box in upper left corner. I blog on anything to do with stroke. DO NOT DO ANYTHING SUGGESTED HERE AS I AM NOT MEDICALLY TRAINED, YOUR DOCTOR IS, LISTEN TO THEM. BUT I BET THEY DON'T KNOW HOW TO GET YOU 100% RECOVERED. I DON'T EITHER BUT HAVE PLENTY OF QUESTIONS FOR YOUR DOCTOR TO ANSWER.
Changing stroke rehab and research worldwide now.Time is Brain!trillions and trillions of neuronsthatDIEeach day because there areNOeffective hyperacute therapies besides tPA(only 12% effective). I have 523 posts on hyperacute therapy, enough for researchers to spend decades proving them out. These are my personal ideas and blog on stroke rehabilitation and stroke research. Do not attempt any of these without checking with your medical provider. Unless you join me in agitating, when you need these therapies they won't be there.
What this blog is for:
My blog is not to help survivors recover, it is to have the 10 million yearly stroke survivors light fires underneath their doctors, stroke hospitals and stroke researchers to get stroke solved. 100% recovery. The stroke medical world is completely failing at that goal, they don't even have it as a goal. Shortly after getting out of the hospital and getting NO information on the process or protocols of stroke rehabilitation and recovery I started searching on the internet and found that no other survivor received useful information. This is an attempt to cover all stroke rehabilitation information that should be readily available to survivors so they can talk with informed knowledge to their medical staff. It lays out what needs to be done to get stroke survivors closer to 100% recovery. It's quite disgusting that this information is not available from every stroke association and doctors group.
Ask your fuckingly incompetent? doctor and hospital to do the research that answers EXACTLY HOW MUCH TO CONSUME! Oh, they are SO INCOMPETENT they can't even manage that simple task?
Theobromine, an alkaloid found in dark chocolate and coffee, is associated with slower cellular aging, a study suggests. December 26, 2025 By Christa Sgobba If you enjoy dark chocolate or coffee, or both, you may be benefiting from a substance found in these products that is linked to a reduction in cellular aging. A study published this month in the journal Aging found that people with higher blood levels of an alkaloid called theobromine seemed to have slower cellular aging as measured by “epigenetic clocks,” models that estimate aging based on molecular biomarkers. Most abundant in cocoa, theobromine is also found in smaller amounts in coffee and tea. But before you start eating more dark chocolate and drinking more cups of coffee, know that the study found an association, not a causal link, and that it didn’t suggest how much you would have to eat or drink to potentially derive an aging-related benefit.
Your competent? doctor is all over healthspan and will guarantee that this research gets done in humans. Oh, you don't trust your doctor to accomplish either point! I wouldn't either.
Summary: Living longer doesn’t always mean living healthier, and researchers are exploring how diet can extend healthspan. A study in worms shows that specific dietary RNA molecules protect cells from harmful protein build-up, a major driver of aging and age-related disease.
These RNAs activate stress responses and autophagy, enhancing resilience and slowing cellular aging across the body. While still early-stage research, the findings suggest diet could play a powerful role in promoting healthier aging in humans too.
Key Facts
Dietary RNA Benefits: Food-based RNAs reduce harmful protein aggregates.
Protective Mechanism: They trigger autophagy and stress resilience pathways.
Whole-Body Impact: Worms lived healthier and more active lives with balanced diets.
Source: University of Basel
People are living longer than ever, but a long life doesn’t necessarily mean a healthy one.
For many, the question isn’t so much “How old do I want to get?” but rather “How do I want to get old?”. While lifespan refers to the years we live from birth to death, “healthspan” describes the number of years we spend in good health.
Healthy aging is also a question of diet. It’s long been known that not just the quantity, but also the individual nutrients impact how we age. Using the tiny worm Caenorhabditis elegans, Spang’s team has now demonstrated that certain RNA molecules in food have a positive effect on the worm’s fitness in old age.
“These molecules prevent the formation of harmful protein aggregates that are typically linked with aging and disease,” says Spang.
The results of their study have been published in “Nature Communications”.
How diet shapes aging
With age, the body becomes less efficient at removing altered and damaged proteins. These can accumulate and form harmful protein aggregates in cells. Such protein aggregates are considered drivers of aging and are associated with multiple age-related diseases including muscular and neurodegenerative diseases such as Alzheimer’s and Parkinson’s disease.
The researchers have discovered that a balanced diet promotes healthspan and specific components in the nematode’s diet exert a protective effect. The worms feed mainly on bacteria that contain double-stranded RNA molecules.
“These dietary RNAs are absorbed in the gut and activate quality-control mechanisms to protect from cellular stress,” explains Emmanouil Kyriakakis, the study’s first author.”
This low-level stress essentially trains the body to cope with protein damage more effectively.”
Diet-dependent mechanisms slow cellular aging
Diet activates autophagy—a cellular “clean-up” process that degrades and recycles damaged proteins. This mechanism reduces harmful protein aggregation and thus slows down cell aging.
“We were surprised to find that the gut communicates with other organs,” says Kyriakakis. “We observed protective effects not only locally, but also in muscles and throughout the whole organism.”
Healthier aging — even in worms Overall, the worms exposed to a balanced diet were more active and healthier in old age. “The dietary-RNA species elicit a systemic stress response that protects the worms from protein aggregation during aging,” says Kyriakakis. “thereby extending their healthspan.”
The findings confirm that diet strongly influences health in old age. “Specific food components can stimulate the body’s own protective mechanisms,” adds Spang.
“So, a little stress can be good for you.” Whether individual nutrients can also spark beneficial effects in humans – and potentially help prevent age-related diseases – remains to be investigated. But it’s certainly conceivable. What is clear already: What we eat can shape the way we age.
Key Questions Answered:
Q: What is healthspan, and how does it differ from lifespan?
A: Healthspan refers to the number of years spent in good health, whereas lifespan is simply the total years lived.
Q: How does diet affect aging at the cellular level?
A: Certain dietary RNA molecules help prevent harmful protein aggregates and activate cellular clean-up processes like autophagy.
Q: What did the study on worms reveal about dietary RNA?
A: Worms fed bacterial RNAs showed reduced protein damage, stronger stress defenses, and healthier aging overall.
About this diet, genetics, and aging research news
Author: Angelika Jacobs Source: University of Basel Contact: Angelika Jacobs – University of Basel Image: The image is credited to Neuroscience News
You might just want this imaging to help you recover from a stroke and maybe prevent dementia. But that means your doctor and stroke hospital have to initiate contact with researchers to get human testing done. They don't contact researchers to get protocols for intervention so this will never occur. You're screwed.
Aging
is characterized by a gradual loss of function occurring at the
molecular, cellular, tissue and organismal levels. At the chromatin
level, aging associates with progressive accumulation of epigenetic
errors that eventually lead to aberrant gene regulation, stem cell
exhaustion, senescence, and deregulated cell/tissue homeostasis. Nuclear
reprogramming to pluripotency can revert both the age and the identity
of any cell to that of an embryonic cell. Recent evidence shows that
transient reprogramming can ameliorate age-associated hallmarks and
extend lifespan in progeroid mice. However, it is unknown how this form
of rejuvenation would apply to naturally aged human cells. Here we show
that transient expression of nuclear reprogramming factors, mediated by
expression of mRNAs, promotes a rapid and broad amelioration of cellular
aging, including resetting of epigenetic clock, reduction of the
inflammatory profile in chondrocytes, and restoration of youthful
regenerative response to aged, human muscle stem cells, in each case
without abolishing cellular identity.
Introduction
The
process of nuclear reprogramming to induced pluripotent stem cells
(iPSCs) is characterized, upon completion, by a profound resetting of
the epigenetic landscape of cells of origin, resulting in reversion of
both cellular identity and age to an embryonic-like state1,2,3,4.
Notably,
if the expression of the reprogramming factors is only transiently
applied and then stopped (before the so-called Point of No Return, PNR)5,
the cells return to the initiating somatic cell state. These
observations suggest that, if applied for a short enough time, the
expression of reprogramming factors fails to erase the epigenetic
signature defining cell identity; however, it remains unknown whether
any substantial and measurable reprogramming of cellular age can be
achieved before the PNR. First evidence that transient reprogramming can
promote amelioration of aging phenotypes was shown by Ocampo et al., in
progeroid mice carrying a Dox-inducible OSKM cassette6.
Yet, important questions remain open. Murine genetic models of
premature aging only in part recapitulate the complexity of natural
aging, a phenomenon that is characterized by a slow and progressive
accumulation of epigenetic errors. In addition, proof is lacking that
the same rejuvenative effect can be achieved with naturally aged human
cells isolated from elderly individuals, together with a comprehensive
molecular and physiological analysis of the depth and extension of the
rejuvenation in human cells. To address all these questions, we devised a
platform that could let us test whether transient expression of nuclear
reprogramming genes has any impact in ameliorating aging phenotypes in
naturally aged human and mouse cells across multiple cell types and
spanning all the hallmarks of aging.
Results
We
first evaluated the effect of transient expression of reprogramming
factors on the transcriptome of two distinct cell types—fibroblasts and
endothelial cells—from aged human subjects, and we compared it with the
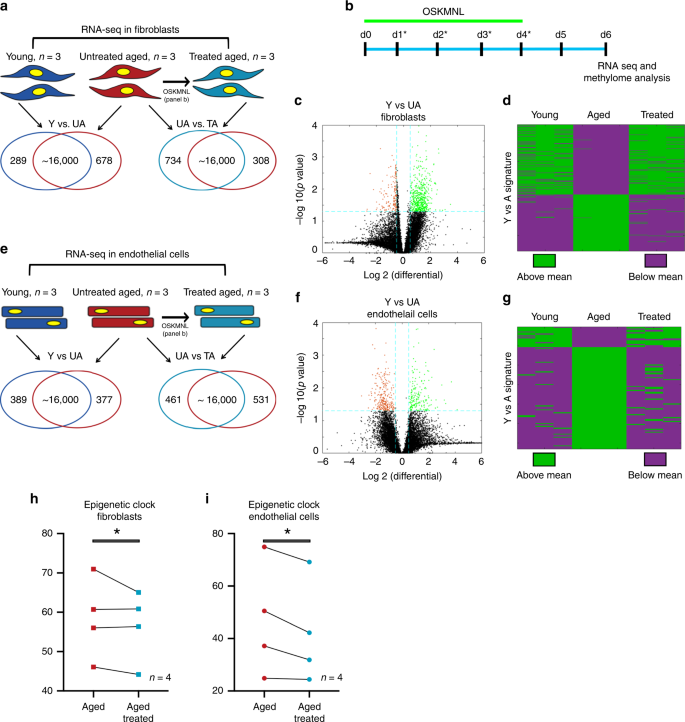
transcriptome of the same cell types isolated from young donors (Fig. 1a, e). Fibroblasts were derived from arm and abdomen skin biopsies (25–35 years for the young control, n = 3, and 60–90 years for the aged group, n = 8), while endothelial cells were extracted from iliac vein and artery (15–25 years for the young control, n = 3, and 50–65 years for the aged group, n = 7).
We utilized a non-integrative reprogramming protocol that we optimized,
based on a cocktail of mRNAs expressing OCT4, SOX2, KLF4, c-MYC, LIN28,
and NANOG (OSKMLN)7.
Our protocol consistently produces iPSC colonies, regardless of age of
the donors, after 12–15 daily transfections; we reasoned that the PNR in
our platform occurs at about day 5 of reprogramming, based on the
observation that the first detectable expression of endogenous
pluripotency-associated lncRNAs occurs at day 58.
Therefore, we adopted a transient exogenous expression regimen where
OSKMLN was daily transfected for 4 consecutive days, and performed gene
expression analysis 2 days after the interruption (Fig. 1b).
Fig.
1: Transcriptomic and epigenetic clock analysis shows more youthful
signature upon transient expression of OSKMNL in human fibroblasts and
endothelial cells.
a Venn diagrams show differentially expressed genes in fibroblasts (young, n = 3 individuals; aged and aged treated n = 3 individuals) defined with at significance p value >0.05 and log fold change >0.5. Comparison among the three groups was conducted by ANOVA test. b Schematic of reprogramming protocol. c Volcano plot showing young versus aged fibroblast differential gene expression. d
Heat map of polarity of expression (green = above, purple = below) the
mean for each differential gene. The distribution shows the treated
samples transition in expression in this space towards the direction of
the young fibroblasts. Cells in each cohort were subjected to 80 bp
paired-end reads of RNA sequencing and quantile normalized. e Venn diagrams show differentially expressed genes in endothelial cells (young, n = 3 individuals; aged and age-treated n = 3 individuals) defined at significance p value >0.05 and log fold change >0.5. Comparison among the three groups was conducted by ANOVA test. f Volcano plot showing young versus aged endothelial cells differential gene expression. g
Heat map of polarity of expression (green = above, purple = below) the
mean for each differential gene. The distribution shows the treated
samples transition in expression in this space towards the direction of
the young endothelial cells. h Methylation clock estimation of patient sample age with and without treatment for fibroblasts; n = 4 individuals. i Methylation clock estimation of patient sample age with and without treatment for endothelial cells; n = 4 individuals. Statistical analysis of methylation clock was performed by two-sided t-test analysis.
We
performed paired-end bulk RNA sequencing on both cell types for the
same three cohorts: young (Y), untreated aged (UA), and treated aged
(TA). First, we compared the quantile normalized transcriptomes of young
and untreated aged cells for each cell type (Y vs. UA) and found that
961 genes (5.85%) in fibroblasts (678 upregulated, 289 downregulated,
Fig. 1a, c) and 748 genes (4.80%) in endothelial cells (389 upregulated, 377 downregulated, Fig. 1e, f) differed between young and aged cells, with the significance criteria of p < 0.05 and a log fold change cutoff ±0.5 (full list of genes in Supplementary Data 1 and 2).
We found these sets of genes were enriched for many of the known aging
pathways, identified in the hallmark gene set collection in the
Molecular Signatures Database9 (Supplementary Data 3 and 4).
When we mapped the directionality of expression above or below the mean
of each gene, we could observe a clear similarity between treated and
young cells as opposed to aged cells for both fibroblasts and
endothelial cells (Fig. 1d, g).
We further performed principal component analysis in this gene set
space and determined that the young and aged populations were separable
along the first principal component (PC1), which explained 64.8% of
variance in fibroblasts and 60.9% of variance in endothelial cells.
Intriguingly, the treated cells also clustered closer to the younger
cells than the aged cells, simply along PC1 (Supplementary Fig. 1a, b).
Using
the same significance criteria defined above, we then compared the
treated and untreated aged populations (TA vs. UA) (Fig 1a, e, Supplementary Fig. 2 and Supplementary Data 5 and 6)
and found that 1042 genes in fibroblasts (734 upregulated and 308
downregulated) and 992 in endothelial cells (461 upregulated and 531
downregulated) were differentially expressed. Interestingly, also within
these sets of genes, we found enrichment for aging pathways, within the
Molecular Signatures Database9 as previously described (Supplementary Data 7 and 8).
When we compared the profiles young versus untreated aged (Y vs. UA)
and untreated aged versus treated aged (UA vs. TA) in each cell type, we
observed a 24.7% overlap for fibroblasts (odds ratio of 4.53, p < 0.05) and 16.7% overlap for endothelial cells (odds ratio of 3.84, p < 0.05)
with the directionality of change in gene expression matching that of
youth (i.e., if higher in young then higher in treated aged); less than
0.5% moved oppositely in either cell types (Supplementary Fig. 1a, b and Supplementary Data 9 and 10).
Next,
we used these transcriptomic profiles to verify retention of cell
identity after treatment. To this end, using established cell identity
markers, we verified that none significantly changed upon treatment
(Supplementary Data 11).
In addition, we could not detect the expression of any
pluripotency-associated markers (other than the OSKMLN mRNAs transfected
in) (Supplementary Data 11).
Altogether, the analysis of the transcriptomic signatures revealed that
OSKLMN expression promotes a very rapid activation of a more youthful
gene expression profile, which is cell-type specific, without affecting
the expression of cell identity genes.
Epigenetic clocks based on
DNA methylation levels are the most accurate molecular biomarkers of age
across tissues and cell types and are predictive of a host of
age-related conditions including lifespan3,10,11,12.
Exogenous expression of canonical reprogramming factors (OSKM) is known
to revert the epigenetic age of primary cells to a prenatal state3.
To test whether transient expression of OSKMLN could reverse the
epigenetic clock of human somatic cells, we used two epigenetic clocks
that apply to human fibroblasts and endothelial cells: Horvath’s
original pan-tissue epigenetic clock (based on 353
cytosine–phosphate–guanine pairs), and the more recent skin-and-blood
clock (based on 391 CpGs)3,13.
According to the pan-tissue epigenetic clock, transient OSKMLN significantly (two-sided mixed-effect model P
value = 0.023) reverted the DNA methylation age (average age
difference = −3.40 years, standard error 1.17). The rejuvenation effect
was more pronounced in endothelial cells (average age difference = −4.94
years, SE = 1.63, Fig. 1i) than in fibroblasts (average age difference = −1.84, SE = 1.46, Fig. 1h).
Qualitatively similar, but less significant results could be obtained
with the skin-and-blood epigenetic clock (overall rejuvenation effect
−1.35 years, SE = 0.67, one-sided mixed-effect model P value = 0.042, and average rejuvenation in endothelial cells and fibroblasts is −1.62 years and −1.07, respectively).
Prompted
by these results, we next analyzed the effect of transient
reprogramming on various hallmarks of cellular physiological aging. We
employed a panel of 11 established assays, spanning the hallmarks of
aging14 (Supplementary Data 12),
and performed most of the analyses using single-cell high-throughput
imaging to capture quantitative changes in single cells and distribution
shifts in the entire population of cells. All the analyses were
performed separately in each individual cell line (total of 19
fibroblast lines: 3 young, 8 aged, and 8 treated aged; total 17
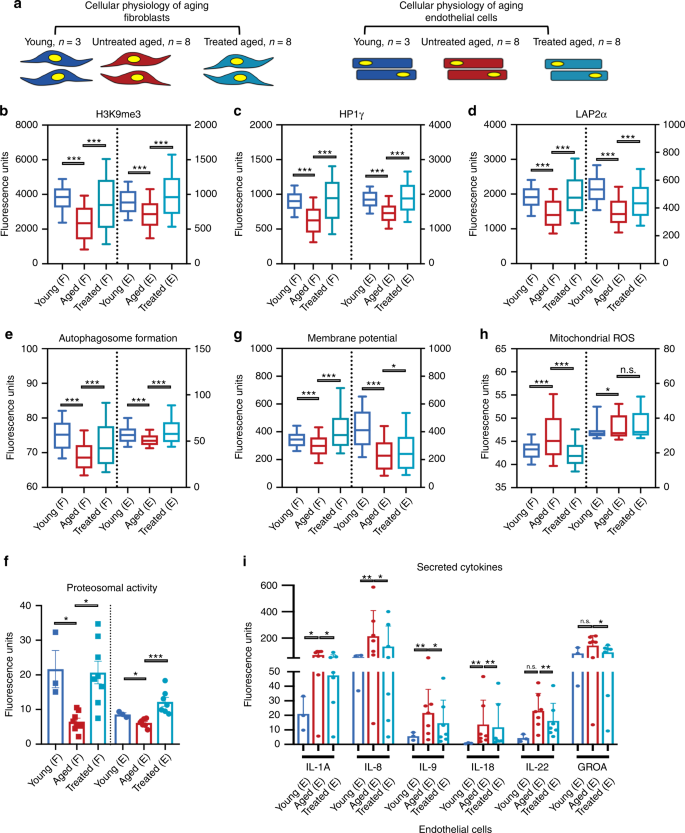
endothelial cell lines: 3 young, 7 aged, and 7 treated aged) (Fig. 2a and Supplementary Figs. 2–5).
Statistical analysis was conducted by randomly sampling 100 cells per
sample; the data was subsequently pooled by group category (see
“Materials and Methods” for a detailed description of the Statistical
methods that were used). Control experiments were performed by adopting
the same transfection scheme using mRNA encoding for green fluorescent
protein (GFP) (Supplementary Figs. 6 and 7).
Fig.
2: Transient OSKMNL expression reverts aged physiology toward a more
youthful state in human fibroblasts and endothelial cells.
a Fibroblasts (F) and endothelial cells were obtained from otherwise healthy young and aged individuals. Young untreated cells (n = 3 distinct individuals for both fibroblasts and endothelial cells, dark blue), aged untreated cells (n = 8 individuals for fibroblast, n = 7 individuals for endothelial cells, red), and aged treated cells (n = 8 for fibroblast, n = 7
for endothelial cells, light blue) were analyzed for a panel of 11
different hallmarks of aging. Most of the assays were performed by
high-throughput imaging on 500–1000 cells per sample to allow
population-wide studies with single-cell resolution (Supplementary
Figs. 2–5).
100 cells per sample (i.e., individuals) were randomly selected and
pooled per treatment group to do a statistical comparison across the
three groups (young fibroblasts n = 300; aged fibroblasts n = 800; aged treated fibroblasts n = 800; young endothelial cells n = 300; aged endothelial cells n = 700; aged treated endothelial cells n = 700). Pairwise statistical analysis was done by one-way ANOVA. *P < 0.05, **P < 0.01, ***P < 0.001. b
Quantification of single-nucleus levels of trimethylated H3K9, a
repressive mark of gene expression. Both cell types show significant
elevation of the mark towards the youthful distribution. c
Quantification of single-nucleus levels of heterochromatin marker HP1γ
by immunocytochemistry showing a trend toward youth upon treatment. d
Quantification of the inner nuclear membrane polypeptide LAP2α, a
regulator of nuclear lamina by regulating the binding of lamin B1 and
chromatin. This again shows a trend toward youth after cells are
treated. e Results of live cells imaging with florescent marker of autophagosome formation in single cells. f
Cleavage of fluorescent-tagged chymotrypsin-like substrate elevated in
treated and young fibroblasts and endothelial cells corresponding to
increased proteasome 20S core particle activity. g Individual
cell mitochondria membrane potential measurements also showing more
active mitochondria as a result of transient reprogramming.
Quantification of pro-inflammatory factors secreted by the cells in each
cohort. h Individual cell mitochondria ROS measurements also showing less accumulated ROS as a result of transient reprogramming. i
Inflammatory cytokine profiling in endothelial cells, with a
significant elevation and depression specifically in aged and treated
endothelial cells, respectively. In b–h data are
represented as box–whisker plots with median, and bars represent
whiskers with distribution variability 10th–90th percentile. In f–j data are represented as mean values and bars represent SD.
To
extend our previous findings on epigenetics, we quantitatively measured
by immunofluorescence (IF) the epigenetic repressive mark H3K9me3, the
heterochromatin-associated protein HP1γ, and the nuclear lamina support protein LAP2α (Fig 2b–d).
Aged fibroblasts and endothelial cells showed a decrease in the nuclear
signal for all three markers compared with young cells, as previously
reported2;
treatment of aged cells resulted in an increase of these markers in
both cell types. Next, we examined both pathways involved in proteolytic
activity of the cells by measuring formation of autophagosomes, and
chymotrypsin-like proteasomal activity, both reported to decrease with
age15,16.
Treatment increased both to levels similar to or even higher than young
cells, suggesting that early steps in reprogramming promote an active
clearance of degraded biomolecules (Fig. 2e, f).
In
terms of energy metabolism, aged cells display decreased mitochondrial
activity, accumulation of reactive oxygen species (ROS), and deregulated
nutrient sensing2,16,17.
We therefore tested the effects of treatment on aged cells by measuring
mitochondria membrane potential, mitochondrial ROS, and levels of
Sirtuin1 protein (SIRT1) in the cells. Transient reprogramming increased
mitochondria membrane potential in both cell types (Fig. 2g), while it decreased mitochondrial ROS (Fig. 2h) and increased SIRT1 protein levels in fibroblasts, similar to young cells (Supplementary Fig. 8).
Senescence-associated beta-galactosidase staining showed a significant
reduction in the number of senescent cells in aged endothelial cells but
not in fibroblasts (Supplementary Fig. 8).
This decrease was accompanied by a decrease in pro-inflammatory
senescence-associated secretory phenotype cytokines again in endothelial
cells and not in fibroblasts (Fig. 2i and Supplementary Fig. 8)16,18,19. Last, in neither cell type did telomere length, measured by quantitative fluorescence in situ hybridization2,20, show significant extension with treatment (Supplementary Fig. 8),
suggesting that the cells did not dedifferentiate into a stem-like
state in which telomerase activity would be reactivated, and in
agreement with previous reports where activation of TERT was observed at
later stages of nuclear reprogramming21.
Next,
we assessed the perdurance of these effects and found that most were
significantly retained after 4 and 6 days from the interruption of
reprogramming (Supplementary Figs. 9 and 10).
We then examined how rapidly these physiological rejuvenative changes
manifest by repeating the same sets of experiments in fibroblasts and
endothelial cells that were transfected for just 2 consecutive days.
Remarkably, we observed that most of the rejuvenative effects could
already be seen after 2 days of treatment, although most were more
moderate (Supplementary Figs. 11 and 12).
Collectively,
this data demonstrates that transient expression of OSKMLN can induce a
rapid, persistent amelioration, and reversal of cellular age in human
somatic cells at the transcriptomic, epigenetic, and cellular levels.
Importantly, these data demonstrate that the process of cellular
rejuvenation is engaged very early, rapidly, and broadly in the
reprogramming process. These epigenetic and transcriptional changes
occur before any epigenetic reprogramming of cellular identity takes
place, a novel finding in the field.
With these indications of a
beneficial effect on cellular aging, we next investigated whether
transient expression of OSKMNL could also reverse the inflammatory
phenotypes associated with aging. After obtaining preliminary evidence
of this reversal in endothelial cells (Fig. 2j),
we extended our analysis to osteoarthritis, a disease strongly
associated with aging and characterized by a pronounced inflammatory
spectrum affecting the chondrocytes within the joint22.
We thus isolated chondrocytes from cartilage of six 60–70-year-old
patients undergoing total joint replacement surgery owing to their
advanced-stage OA, and compared the results of treatment with
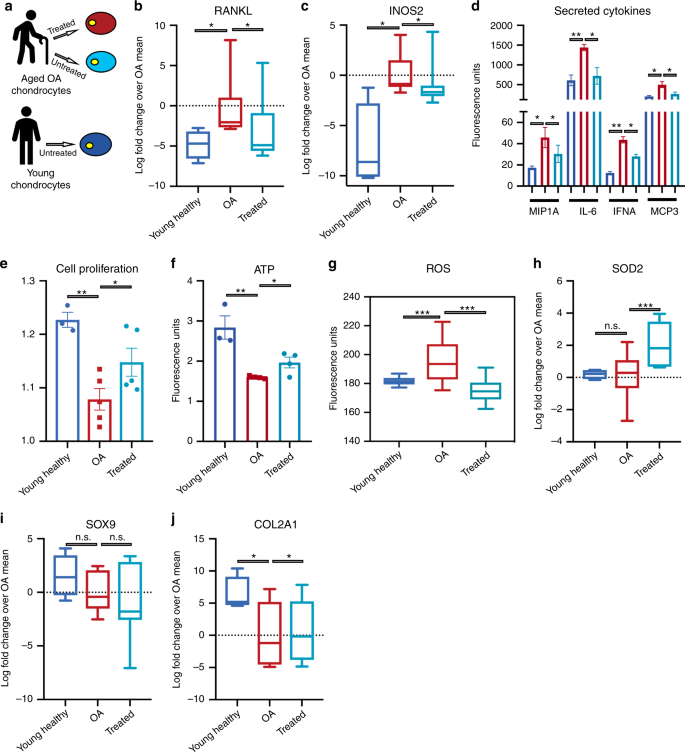
chondrocytes isolated from three young individuals (Fig. 3a).
Transient OSKMLN expression was performed for 2 or 3 days, and the
analysis performed after 2 days from interruption of reprogramming,
though the more consistent effect across patients was with longer
treatment. Treatment showed a significant reduction in intracellular
mRNA levels of RANKL and iNOS2, as well as in levels of inflammatory
factors secreted by the cells (Fig. 3b–d). In addition, we observed increased cell proliferation (Fig. 3e), increased ATP production (Fig. 3f), and decreased oxidative stress as revealed by reduced mitochondrial ROS and elevated RNA levels of antioxidant SOD2 (Fig. 3g, h), a gene that has been shown to be downregulated in OA23.
Finally, when we checked for retention of cellular identity, we
observed that the treatment did not affect the expression level of SOX9
(a transcription factor core to chondrocyte identity and function) and
significantly increased the level of expression of COL2A1 (the primary
collagen in articular cartilage) (qRT-PCR in Fig 3i, j),
suggesting retention of chrondrogenic cell identity. Together, these
results show that transient expression of OSKMLN can promote a partial
reversal of gene expression and cellular physiology in aged OA
chondrocytes toward a healthier, more youthful state, suggesting a
potential new therapeutic strategy to ameliorate the OA disease process.
a
Workflow summarizing the strategy adopted to mitigation of age-related
disease. Chondrocytes were obtained from six distinct aged patients
diagnosed late stage Osteoarthritis (OA) patients from cartilage
biopsies. Healthy cells (blue), aged OA cells (red) and transiently
reprogrammed OA cells (light blue) were evaluated for OA specific
phenotypes. b qRT-PCR evaluation shows treatment diminishes of intracellular RNA levels of NF-κB ligand RANKL. c
qRT-PCR evaluation shows treatment drops levels of iNOS for producing
nitric oxide as a response and to propagate inflammatory stimulus. d
Cytokine profiling of chondrocyte secretions shows an increase
pro-inflammatory cytokines in OA chondrocytes that diminishes with
treatment. e Cell proliferation rate as measured by cell-tracking dye. f Measurement of ATP concentration using glycerol based fluorophore shows elevation of ATP levels with treatment. g Live single-cell image of cells up taking superoxide triggered fluorescent dyes shows diminished signal after treatment. h qRT-PCR evaluation of RNA levels of antioxidant SOD2, elevated with treatment. i qRT-PCR levels of chondrogenic identity and function transcription factor SOX9 is retained after treatment. j qRT-PCR shows elevation RNA levels for extracellular matrix protein component. Young samples n = 3 individuals; aged OA samples treated and untreated n = 6 individuals. Pairwise statistical analysis was done by one-way ANOVA. For ROS (g)
analysis was conducted by high-throughput imaging on 500–1000 cells per
sample to allow population-wide studies with single-cell resolution.
One-hundred cells per sample were randomly selected to do a statistical
comparison across the three groups. Statistical analysis was then done
by one-way ANOVA. *P < 0.05, **P < 0.01, ***P < 0.001. Statistical analysis by one-way ANOVA was conducted for all the other assays.
Stem cell loss of function and regenerative capacity represents another important hallmark of aging14.
We thus wanted to assess the effect of transient reprogramming on the
age-related changes in somatic stem cells that impair regeneration.
First, we tested the effect of transient reprogramming on mouse-derived
skeletal muscle stem cells (MuSCs). We treated MuSCs for 2 days while
they were kept in a quiescent state using an artificial niche24. We conducted initial experiments with young (3 month) and aged (20–24 months) murine MuSCs isolated by FACS (Fig. 4a).
Treatment of aged MuSCs reduced both time of first division,
approaching the faster activation kinetics of quiescent young MuSCs25,26, and mitochondrial mass27 (Supplementary Fig. 13a, b). Moreover, treatment partially rescued the reduced ability of single MuSCs to form colonies25,28 (Supplementary Fig. 13c).
We further cultured these cells and observed that treatment did not
change expression of the myogenic marker MyoD but instead improved their
capacity to differentiate into myotubes (Supplementary Fig. 14a–d), suggesting that transient reprogramming does not disrupt the myogenic fate but can enhance the myogenic potential.
a Schematic showing the experimental design of partially reprogrammed aged mouse and human MuSCs. b
Representative images of bioluminescence measured from mice 11 days
after transplantation and injury in TiA muscles of treated/untreated
Luciferase+ mouse MuSCs. c Quantified results of bioluminescence in b at different time points following transplantation and injury (n = 10). d Representative immunofluorescence of GFP expression in TiA muscle cross-sections of mice imaged and quantified in c and d, isolated 11 days after transplantation (Scale bar = 500 μm). e Quantification of immunofluorescence staining in d (n = 5). f
Quantification of the cross-sectional area of donor-derived
GFP + fibers in TiA muscles that were recipients of transplanted MuSCs (n = 5). g Results of bioluminescence imaging of TiA muscles reinjured after 60 days (second injury) after MuSC transplantations (n = 6).
The second injury was performed to test whether the bioluminescence
signal increased as a consequence of activating and expanding luciferase+/GFP+ MuSCs that were initially transplanted and that had engrafted under the basal lamina. h
Tetanic force measurements of aged muscles injured and transplanted
with aged MuSCs. TiA muscles were dissected and electrophysiology ex
vivo for tetanic measurement performed. Baseline of force production of
untransplanted muscles was measured in young (4 months, blue broken
line) and aged (27 months, red broken line) mice. Treated aged MuSCs
were transplanted into TiA muscles of aged mice and force production
measured 30 days later (n = 5). i Quantified results of bioluminescence measured from mice 11 days after transplantation in TiA muscles of treated Luciferase+ human MuSCs. j
Variation in ratio of bioluminescence between treated and untreated
MuSCs obtained from healthy donors of different age groups. Significance
is calculated with one-sided student’s t test, pairwise between treated and aged, and group wise when comparing with young patients (age groups. 10–30: n = 5 individuals; 30–55: n = 7 individuals; 60–80: n = 5 individuals). *P < 0.05, **P < 0.01, ***P < 0.001, color of the asterisks matches the population being compared with.
Next,
we wanted to test MuSC function and potency to regenerate new tissue in
vivo. To do this, we transduced young, aged, or transiently
reprogrammed aged MuSCs with a lentivirus-expressing luciferase and GFP,
and then transplanted the cells into injured tibialis anterior (TiA)
muscles of immunocompromised mice. Longitudinal bioluminescence imaging
(BLI) initially showed that muscles transplanted with treated aged MuSCs
showed the highest signal (day 4, Fig 4b, c),
but became comparable with muscles with young MuSCs by day 11 post
transplantation; conversely muscle with untreated aged MuSCs showed
lower signals at all time points post transplantation (Fig. 4b, c). IF analysis further revealed higher numbers of donor-derived (GFP+) myofibers in TiAs transplanted with treated compared with untreated aged MuSCs (Fig. 4d, e). Moreover, the GFP+
myofibers from treated aged cells exhibited increased cross-sectional
areas when compared with their untreated counterparts, and in fact even
larger than the young controls (Fig. 4f).
Together, these results suggest improved tissue regenerative potential
of transiently reprogrammed aged MuSCs. After 3 months, all mice were
subjected to autopsy, and no neoplastic lesions or teratomas were
discovered (Supplementary Table 1).
To test potential long-term benefits of the treatment, we induced a
second injury 60 days after cell transplantation, and again observed
that TiA muscles transplanted with transiently reprogrammed aged MuSCs
yielded higher BLI signals (Fig. 4g).
Sarcopenia is an age-related condition that is characterized by loss of muscle mass and force production29,30. Similarly, in mice muscle functions show progressive degeneration with age31,32.
We wanted to test whether transient reprogramming of aged MuSCs would
improve a cell-based treatment in restoring physiological functions of
muscle of older mice. To test this, we first performed electrophysiology
to measure tetanic force production in TiA muscles isolated from young
(4 months) or aged (27 months) immunocompromised mice. We found that TiA
muscles from aged mice have lower tetanic forces compared with young
mice, suggesting an age-related loss of force production (Fig. 4h).
Next, we isolated MuSCs from aged mice (20–24 months). After treating
aged MuSCs, we transplanted them into cardiotoxin-injured TiA muscles of
aged (20 months) immunocompromised mice. We waited 30 days to give
enough time to the transplanted muscles to fully regenerate. We then
performed electrophysiology to measure tetanic force production. Muscles
transplanted with untreated aged MuSCs showed forces comparable with
untransplanted muscles from aged control mice (Fig. 4h).
Conversely, muscles that received treated aged MuSCs showed tetanic
forces comparable with untransplanted muscles from young control mice
(Fig. 4h and Supplementary Fig. 15a).
These results suggest that transient reprogramming in combination with
MuSC-based therapy can restore physiological function of aged muscles to
that of youthful muscles.
Last, we wanted to translate these
results to human MuSCs. We repeated the study, employing operative
samples obtained from patients in different age ranges (10–80 years
old), and transducing them with GFP- and luciferase-expressing
lentiviral vectors (Fig. 4a).
As in mice, transplanted, transiently reprogrammed, aged human MuSCs
resulted in increased BLI signals compared with untreated MuSCs from the
same individual, and comparable with those observed with young MuSCs
(Fig. 4i and Supplementary Fig. 16a, b).
Interestingly, the BLI signal ratio between contralateral muscles with
treated and untreated MuSCs was higher in the older age group (60–80
years old) than in the younger age groups (10–30 or 30–55 years old),
suggesting that ERA restores lost functions to younger levels in aged
cells (Fig. 4j).
Taken together, these results suggest that transient reprogramming
partially restores the potency of aged MuSCs to a degree similar to that
of young MuSCs, without compromising their fate, and thus has potential
as a cell therapy in regenerative medicine.
Nuclear reprogramming to iPSCs is a multi-phased process comprising initiation, maturation, and stabilization33.
Upon completion of such a dynamic and complex epigenetic reprogramming,
iPSCs are not only pluripotent but also youthful. While proof of
principle that transient reprogramming can exert a systemic rejuvenation
in a genetic model of aging (progeroid mice), the proof that a
multispectral cellular rejuvenation could be achieved in a
cell-autonomous fashion in human cells isolated from naturally aged
individuals was missing. Here we demonstrate that a non-integrative,
mRNAs-based platform of transient cellular reprogramming can very
rapidly reverse a broad spectrum of aging hallmarks in the initiation
phase, when epigenetic erasure of cell identity has not yet occurred. We
show that the process of rejuvenation occurs in naturally aged human
and mouse cells, with restoration of lost functionality in diseased
cells and aged stem cells while preserving cellular identity. Future
studies are required to elucidate the mechanism that drives the reversal
of the aged phenotype during cellular reprogramming, uncoupling it from
dedifferentiation process34,35.
Our results are novel and represent a significant step toward the goal
of reversing cellular aging, and have potential therapeutic implications
for aging and aging-related diseases.
Methods
Human fibroblast isolation and culture
Isolation
was performed at Coriell Institute on healthy patients and from
Alzheimer patient samples at Stanford Hospital, in accordance to the
methods and protocols approved by the Institutional Review Board of
Stanford University, biopsied for skin mesial aspect of mid-upper arm or
abdomen using 2-mm punch biopsies from both male and female patients
60–70 years old (n = 8) and 25–35 years (n = 3). Cells
were cultured out from these explants and maintained in Eagle’s Minimum
Essential Medium with Earl’s salts supplemented with nonessential amino
acids, 10% fetal bovine serum, and 1% Penicillin/Streptomycin. Cells
were cultured at 37 °C with 5% CO2.
Human endothelial cell isolation and culture
Isolation
was performed at Coriell Institute from iliac arteries and veins, and
muscle biopsies from Stanford Hospital, in accordance to the methods and
protocols approved by the Institutional Review Board of Stanford
University, from otherwise healthy 45–60 years old (n = 7).
Tissue was digested with collagenase and cells released from the lumen
were used to initiate cultures. Plates for seeding were coated with 2%
gelatin, then washed with PBS before use. Cells were maintained in
Medium 199 supplemented with 2 mM l-glutamine,
15% fetal bovine serum, 0.02 mg/ml Endothelial Growth Supplement,
0.05 mg/ml Heparin, and 1% Penicillin/Streptomycin. Cells were cultured
at 37 °C with 5% CO2.
Human articular chondrocyte isolation and culture
In
accordance to the methods and protocols approved by Institutional
Review Board of Stanford University, the human OA chondrocytes were
derived from discarded tissues of OA patients (50–72 years of age, n = 6)
undergoing total knee arthroplasty. The samples were surgical waste and
were fully deidentified prior to procurement, hence no prior patient
consent was required. Cartilage pieces were shaved off bone by scalpel,
taking care to avoid any fat, then digested with collagenase in DMEM/F12
media (supplemented with 25 mg/ml ascorbate, 2 mM l-glutamine,
1% penicillin/streptomycin antibiotics, and 10% fetal bovine serum) for
1–2 days until shavings were substantially dissolved. Supernatant from
cultures was strained, filtered, and centrifuged, and the cells were
then resuspended in fresh media. The chondrocytes were cultured in
high-density monolayer at 37 °C with 5% CO2.
Mice
C57BL/6
male and NSG mice were obtained from Jackson Laboratory.
NOD/MrkBomTac-Prkdcscid mice were obtained from Taconic Biosciences.
Mice were housed and maintained in the Veterinary Medical Unit at the
Veterans Affairs Palo Alto Health Care Systems. The Administrative Panel
on Laboratory Animal Care of Stanford University approved animal
protocols.
Human skeletal muscle specimens
The human muscle biopsy specimens were taken after patients (10–30 years, n = 2; 30–55 years, n = 2; 60–80 years, n = 3)
gave informed consent as part of a human studies research protocol that
was approved by the Stanford University Institutional Review Board.
Sample processing for cell analysis began within 1–12 h of specimen
isolation. In all studies, standard deviation reflects variability in
data derived from studies using true biological replicates (i.e., unique
donors). Data were not correlated with donor identity.
MuSC isolation and purification
Muscles were harvested from mouse hind limbs (n = 4)
and mechanically dissociated to yield a fragmented muscle suspension.
This was followed by a 45–50-min digestion in a Collagenase II-Ham’s F10
solution (500 U ml−1, Invitrogen). After washing, a second digestion was performed for 30 min with Collagenase II (100 U ml−1) and Dispase (2 U ml−1,
ThermoFisher). The resulting cell suspension was washed, filtered, and
stained with VCAM-biotin, CD31-FITC, CD45-APC, and Sca-1-Pacific-Blue
antibodies, all at dilutions of 1:100. Human MuSCs were purified from
fresh operative samples. Operative samples were carefully dissected from
adipose and fibrotic tissue and a dissociated muscle suspension
prepared as described for mouse tissue. The resulting cell suspension
was then washed, filtered, and stained with anti-CD31-Alexa Fluor 488,
anti-CD45-Alexa Fluor 488, anti-CD34-FITC, anti-CD29-APC, and
anti-NCAM-Biotin antibodies. Unconjugated primary antibodies were then
washed and the cells were incubated for 15 min at 4 °C in
streptavidin-PE/Cy7 to detect NCAM-biotin. Cell sorting was performed on
calibrated BD-FACSAria II or BD FACSAria III flow cytometers equipped
with 488-, 633-, and 405-nm lasers to obtain the MuSC population. A
small fraction of sorted cells was plated and stained for Pax7 and MyoD
to assess the purity of the sorted population.
mRNA transfection
Cells
were transfected using either mRNA-In (mTI Global Stem) for fibroblasts
and chondrocytes, to reduce cell toxicity, or Lipofectamine
MessengerMax (ThermoFisher) for endothelial cells and MuSCs, which were
more difficult to transfect, using the manufacturer’s protocol. For
fibroblast and endothelial cells, serum free Pluriton medium with bFGF
was used for transfection, while muscle stem cells and chondrocytes were
kept in their original media—the former lacking serum and the later
requiring serum to prevent the natural dedifferentiation of chondrocytes
in culture. Culture medium was changed for fibroblasts and endothelial
cells 4 h after transfection, but not for chondrocytes or MuSCs as
overnight incubation was needed to produce a significant uptake of mRNA.
Efficiency of delivery was confirmed by both GFP mRNA and
immunostaining for individual factors in OSKMLN cocktail, the former
also being used as a transfection control with the same protocol.
Immunocytochemistry
Cells
were washed with HBSS/CA/MG and then fixed with 15% paraformaldehyde in
PBS for 15 min. Cells were then blocked for 30 min to 1 h with a
blocking solution of 1% BSA and 0.3% Triton X-100 in PBS for
fibroblasts, endothelial cells, and 20% donkey serum/0.3% Triton in PBS
for MuSCs. Primary antibodies were then applied in blocking solution and
allowed to incubate overnight at 4 °C. The following day, the cells
were washed with HBSS/CA/MG or PBST for MuSCs before switching to the
corresponding Alexa Fluor-labeled secondary antibodies and incubated for
2 h. The cells were then washed again and stained with DAPI for 30 min
and switched to HBSS/CA/MG for imaging or Fluoview for MuSCs.
Autophagosome formation staining
Cells
were washed with HBSS/Ca/Mg and switched to a staining solution
containing a proprietary fluorescent autophagosome marker (Sigma). The
cells were then incubated at 37 °C in 5% CO2 for 20 min,
washed two times using HBSS/Ca/Mg, and stained for 15 min using
CellTracker Deep Red cell labeling dye. Cells were then switched to
HBSS/Ca/Mg for single-cell imaging using the Operetta High-Content
Imaging System (Perkin Elmer).
Proteasome activity measurement
Wells
were first stained with PrestoBlue Cell Viability dye (Life
Technologies) for 10 min. Well signals were read using a TECAN
fluorescent plate reader as a measure of cell count. Then cells were
washed with HBSS/Ca/Mg before switching to original media containing the
chymotrypsin-like fluorogenic substrate LLVY-R110 (Sigma), which is
cleaved by proteasome 20S core particle. Cells were then incubated at
37 °C in 5% CO2 for 2 h before signals were again read on the
TECAN fluorescent plate reader. Readings were then normalized by
PrestoBlue cell count.
Mitochondrial membrane potential staining
Tetramethylrhodamine
Methyl Ester Perchlorate (Thermo) was added to cell culture media. This
dye is sequestered by active mitochondria based on their membrane
potential. Cells were incubated for 30 min at 37 °C in 5% CO2
and washed two times with HBSS/Ca/Mg before staining for 15 min using
CellTracker Deep Red. Finally, cells were imaged in fresh HBSS/Ca/Mg
using the Operetta High-Content Imaging System (Perkin Elmer).
Mitochondrial ROS measurement
Cells
were washed with HBSS/Ca/Mg and then switched to HBSS/Ca/Mg containing
MitoSOX (Thermo), a live-cell-permeant fluorogenic dye that selectively
targeted to mitochondria and fluoresces when oxidized by superoxide.
Cells were incubated for 10 min at 37 °C in 5% CO2. Cells
were then washed twice with HBSS/Ca/Mg, and stained for 15 min using
CellTracker Deep Red. Finally, cells were imaged in fresh HBSS/Ca/Mg
using the Operetta High-Content Imaging System (Perkin Elmer).
SAβGal histochemistry
Cells
were washed twice with PBS then fixed with 15% Paraformaldehyde in PBS
for 6 min. Cells were rinsed three times with PBS before staining with
X-gal chromogenic substrate, which is cleaved by endogenous Beta
galactosidase. Plates were kept in the staining solution, Parafilmed, to
prevent from drying out, and incubated overnight at 37 °C with ambient
CO2. The next day, cells were washed again with PBS before
switching to a 70% glycerol solution for imaging under a Leica
bright-field microscope.
Fixed and live-cell imaging
Samples
were imaged using fluorescent microscopes—the Operetta High-Content
Imaging System (Perkin Elmer) or the BZ-X700 (Keyence)—and either a 10×
or 20× air objective. Harmony (Operetta) or Volocity (BZ-X700) imaging
software was used to adjust excitation and emission filters and came
with preprogrammed Alexa Fluor filter settings which were used whenever
possible. All exposure times were optimized during the first round of
imaging, and then kept constant through all subsequent imaging.
Image analysis
Columbus
(Operetta) or Image J (BZ-X700) was used for image analysis. Columbus
software was to identify single cells utilizing DAPI of CellTracker Re d
to delineate nuclear and cell boundaries and calculate the signal
statistics for each cell. Image J was used for muscle fibers to
calculate the percentage of area composed of collagen by using the color
threshold plug-in to create a mask of only the area positive for
collagen. That area was then divided over the total area of the sample,
which was found using the free draw tool. All other fiber analyses were
performed using Volocity software and manually counting fibers using the
free draw tool.
Statistics
Statistical analysis for physiological hallmarks of aging was done as described previously in Miller et al.2. Briefly, 100 cells were randomly selected from each experimental group (data depicted in Supplementary Figs. 2–5),
and they were then pooled in a unique population of 800 cells for aged
fibroblasts (100 cells × 8 individuals for both aged and aged treated);
300 cells for young fibroblasts (100 cells × 3 individuals); 700 cells
for aged endothelial cells (100 cells × 7 individuals for both aged and
aged treated); 300 cells for young endothelial cells (100 cells × 3
individuals). Box distribution plots display the fluorescence intensity
quantification of 100 cells from each patient. Distributions were
compared by statistical analysis by using multiple-comparison ANOVA.
Arbitrary units for frequency distributions of different cell types
should not be compared because staining was performed at different
times. Matlab 2017 (MathWorks) was used for data presentation and
analysis.
Cytokine profiling
This
work was performed together with the Human Immune Monitoring Center at
Stanford University. Cell media was harvested and spun at 400 rcf for
10 min at room temperature. The supernatant was then snap frozen with
liquid nitrogen until analysis. Analysis was done using the human
63-plex kit (eBiosciences/Affymetrix). Beads were added to a 96-well
plate and washed in a Biotek ELx405 washer. Samples were added to the
plate containing the mixed antibody-linked beads and incubated at room
temperature for 1 h followed by overnight incubation at 4 °C with
shaking. Cold and room temperature incubation steps were performed on an
orbital shaker at 500–600 rpm. Following the overnight incubation,
plates were washed in a Biotek ELx405 washer and then biotinylated
detection antibody added for 75 min at room temperature with shaking.
Plates were washed as above and streptavidin-PE was added. After
incubation for 30 min at room temperature, wash was performed as above
and reading buffer was added to the wells. Each sample was measured in
duplicate. Plates were read using a Luminex 200 instrument with a lower
bound of 50 beads per sample per cytokine. Custom assay Control beads by
Radix Biosolutions were added to all wells.
Cells
were washed and digested by TRIzol (Thermo). Total RNA was isolated
using the Total RNA Purification Kit (Norgen Biotek Corp) and RNA
quality was assessed by the RNA analysis screentape (R6K screentape,
Agilent); RNA with RIN > 9 was reverse transcribed to cDNA. cDNA
libraries were prepared using 1 μg of total RNA using the TruSeq RNA
Sample Preparation Kit v2 (Illumina). RNA quality was assessed by an
Agilent Bioanalyzer 2100; RNA with RIN > 9 was reverse transcribed to
cDNA. cDNA libraries were prepared using 500 ng of total RNA using the
TruSeq RNA Sample Preparation Kit v2 (Illumina) with the added benefit
of molecular indexing. Prior to any PCR amplification steps, all cDNA
fragment ends were ligated at random to a pair of adapters containing a
8-bp unique molecular index. The molecular indexed cDNA libraries were
than PCR amplified (15 cycles) and then QC’ed using a Bioanalzyer and
Qubit. Upon successful QC, they were sequenced on an Illumina Nextseq
platform to obtain 80-bp single-end reads. The reads were trimmed by
2 nt on each end to remove low-quality parts and improve mapping to the
genome. The 78-nt reads that resulted were compressed by removing
duplicates, while keeping track of how many times each sequence occurred
in each sample in a database. The unique reads were then mapped to the
human genome using exact matches. This misses reads that cross exon–exon
boundaries, as well as reads with errors and SNPs/mutations, but it
does not have substantial impact on estimating the levels of expression
of each gene. Each mapped read was then assigned annotations from the
underlying genome. In case of multiple annotations (e.g., a miRNA
occurring in the intron of a gene), a hierarchy based on heuristics was
used to give a unique identity to each read. This was then used to
identify the reads belonging to each transcript and coverage over each
position on the transcript was established. This coverage is nonuniform
and spiky. Therefore, we used the median of this coverage as an estimate
of the expression value of each gene. In order to compare the
expression levels in different samples, quantile normalization was used.
Further data analysis was done in Matlab. Ratios of expression levels
were then calculated to estimate the log (base 2) of the fold change.
Student’s t test was used to determine significance with a p < 0.05 cutoff. Molecular Signatures Database categorization was done using Broad Institute online tools https://software.broadinstitute.org/gsea/msigdb/.
Gene expression analysis
Total
RNA was purified using the RNeasy Plus Mini kit (Qiagen), and cDNA was
prepared with the First-strand cDNA synthesis kit (Applied Biosystems).
The quantitative polymerase chain reaction was performed using VeriQuest
Mastermix (ThermoFisher Scientific) for SYBR Green and Taqman primer
sets, respectively. The relative gene expression was analyzed by the
ΔΔCt method and normalized to glyceraldehyde-3-phosphate dehydrogenase
(GAPDH). The Taqman probes for human GAPDH (Hs02758991); COL2A1
(Hs00264051); SOX9 (Hs00165814); MMP3 (Hs00233962) and MMP13
(Hs00233992) were purchased from Applied Biosystems. The SYBR green
primer sequences used are: Human SOD2 (F)-5′GGC CTA CGT GAA CAA CCT
GA3′; Human SOD2 (R)-5′TGG GCT GTA ACA TCT CCC TTG3′; Human iNOS
(F)-5′GTC CCG AAG TTC TCA AGG CA3′; Human iNOS (R)-5′GTT CTT CAC TGT GGG
GCT TG3′; Human RANKL (F)-5′CAG GTT GTC TGC AGC GT3′ and Human RANKL
(R)-5′GAT CCA TCT GCG CTC TGA AAT A3′; Human GAPDH (F)- 5′TGT CCC CAC
TGC CAA CGT GTC3′; Human GAPDH (R)-5′AGC GTC AAA GGT GGA GGA GTG GGT3′.
ATP assay
ATP
in the chondrocytes was measured using colorimetric assay and the ATP
assay kit (ab83355; Abcam, Cambridge, MA) following the manufacturer’s
instructions. Cells were washed in cold phosphate buffered saline and
homogenized and centrifuged to collect the supernatant. The samples were
loaded with assay buffer in triplicate. ATP reaction mix and background
control (50 µL) was added to the wells and incubated for 30 min in
dark. The plate was read at OD 570 nm using SpectraMax M2e (Molecular
Devices, Sunnyvale, CA). The mean optical density was used to estimate
of the intracellular ATP concentration relative to the standard curve.
Cell proliferation assay
Cell
viability was assayed using the PrestoBlue Cell Viability (Life
Technologies) reagent consecutively for 3 days post transfection in
accordance with the manufacturer’s instructions. PrestoBlue reagent was
added to the cell culture medium, and the cells were incubated at 30 °C
for 30 min. Absorbance of the PrestoBlue was measured daily using
SpectraMax M2e (Molecular Devices, Sunnyvale, CA).
EDU staining
Staining
was done according to the manufacturer’s protocol using the Click-iT
EdU kit. Cells were labeled with Edu after switching to growth media.
Cells were allowed to grow 1 or 2 days before fixation with 4%
paraformaldehyde and permeabilization with 0.5% Triton X-100 in PBST.
Cells were the incubated in Click-It reaction cocktail for 30 min before
washing in PBS and imaging.
MitoTracker staining and flow cytometry analysis
Cells
were washed twice with Ham’s F10 (no serum or pen/strep). Subsequently,
MuSCs were stained with MitoTracker Green FM (ThermoFisher, M7514) and
DAPI for 30 min at 37 °C, washed three times with Ham’s F10, and
analyzed using a BD FACSAria III flow cytometer.
Myogenic colony-forming cell assay for MuSCs
Single
treated and control MuSCs were deposited into wells of collagen- and
laminin-coated plates at one cell per well by BD FACSAria III flow
cytometer. Collagen/laminin coating was accomplished by overnight
incubation of the plates rocking at 4 °C with a 1:1 mixture of laminin
(10 μg/ml ThermoFisher 23017-015) and collagen (10 μg/ml Sigma C8919) in
PBS. Coated wells were washed three times with PBS before use. The
cells were cultured in grow media, F10 medium supplemented with 20%
horse serum, and 5 ng/ml basic fibroblast growth factor (bFGF; PeproTech
100-18B). After 6 days of culture, plates were fixed with 4%
paraformaldehyde (Electron Microscopy Services 15710), stained with DAPI
(Invitrogen D1306), and scored by microscopy to determine the number of
myogenic colony-forming cells, defined by wells that contained at least
eight cells.
Myogenic/fusion index
Myogenic analysis was completed as previously described36.
After MuSCs underwent reprogramming or control treatment, cells were
cultured in grow media. To induce differentiation, myoblast cultures
were maintained in DMEM supplemented with 2% horse serum. The
myogenic/fusion index was determined as the percentage of myonuclei in
myotubes (defined as cells with three or more nuclei) compared with the
total number of nuclei in the field.
Lentiviral transduction
Luciferase
and GFP protein reporters were subcloned into a third-generation HIV-1
lentiviral vector (CD51X DPS, SystemBio). To transduce freshly isolated
MuSCs, cells were plated on a Poly-D-Lysine (Millipore Sigma, A-003-E)
and ECM coated eight-well chamber slide (Millipore Sigma, PEZGS0896) and
were incubated with 5 μl of concentrated virus per well and 8 μg/mL
polybrene (Santa Cruz Biotechnology, sc-134220). Plates were spun for
5 min at 3200 g, and for 1 h at 2500 g at 25 °C. Cells
were then washed with fresh media two times, scraped from plates, and
resuspended in the final volume according to the experimental
conditions.
Bioluminescence imaging
Bioluminescent
imaging was performed using the Xenogen IVIS-Spectrum System (Caliper
Life Sciences). Mice were anesthetized using 2% isoflurane at a flow
rate of 2.5 l/min Intraperitoneal injection of d-Luciferin
(50 mg/ml, Biosynth International Inc.) dissolved in sterile PBS was
administered. Immediately following the injection, mice were imaged for
30 s at maximum sensitivity (f-stop 1) at the highest resolution (small
binning). Every minute, a 30-s exposure was taken until the peak
intensity of the bioluminescent signal began to diminish. Each image was
saved for subsequent analysis.
Bioluminescence image analysis
Analysis
of each image was performed using Living Image Software, version 4.0
(Caliper Life Sciences). A manually generated circle was placed on top
of the region of interest and resized to completely surround the limb or
the specified region on the recipient mouse. Similarly, a background
region of interest was placed on a region of a mouse outside the
transplanted leg.
Tissue harvesting
TiA
muscles were carefully dissected away from the bone, weighed, and
placed into a 0.5% PFA solution for fixation overnight. The muscles were
then moved to a 20% sucrose solution for 3 h or until muscles reached
their saturation point and began to sink. The tissues were then embedded
and frozen in Optimal Cutting Temperature (OCT) medium and stored at
−80 °C until sectioning. Sectioning was performed on a Leica CM3050S
cryostat that was set to generate 10-μm sections. Sections were mounted
on Fisherbrand Colorfrost slides. These slides were stored at −20 °C
until immunohistochemistry could be performed.
Flow cytometry
For mouse MuSC sorting scheme, we followed the same gating strategy previously published37. For human MuSC sorting scheme, we followed the same strategy previously published38.
Histology
TiA
muscles were fixed for 5 h using 0.5% electron-microscopy-grade
paraformaldehyde and subsequently transferred to 20% sucrose overnight.
Muscles were then frozen in OCT, cryosectioned at a thickness of 10 μm,
and stained. For colorimetric staining with Hematoxylin and Eosin
(Sigma) or Gomori Trichrome (Richard-Allan Scientific), samples were
processed according to the manufacturer’s recommended protocols.
Ex vivo force measurement
To
measure the force, we isolated the TiA in a bath of oxygenated Ringer’s
solution and stimulated it with plate electrodes. Immediately after
euthanasia, the distal tendon of the TiA, the TiA, and the knee
(proximal tibia, distal femur, patella, and associated soft tissues)
were dissected out and placed in Ringer’s solution (Sigma) maintained at
25 °C with bubbling oxygen with 5% carbon dioxide. The proximal tibia
was sutured to a rigid wire attached to the force transducer, and the
distal tendon was sutured to a rigid fixture. No suture loops or slack
was present in the system. The contralateral limb was immediately
dissected and kept under low passive tension in oxygenated Ringer’s
solution bath until measurement. Supramaximal stimulation voltage was
found, and the active force-length curve was measured in a manner
similar to the in vivo condition. After measurement, the muscle was
dissected free and the mass measured. An Aurora Scientific 1300-A Whole
Mouse Test System was used to gather force production data.
DNA methylation data
The human Illumina Infinium EPIC 850K chip was applied to n = 16
DNA samples (corresponding to two treatment levels (before/after
treatment) of four fibroblasts and four endothelial cells). The raw
image data were normalized using the “preprocessQuantile” normalization
method implemented in the “minfi” R package39,40.
Epigenetic clock analysis
Several
DNAm-based biomarkers have been proposed in the literature, which
differ in terms of their applicability (most were developed from blood),
and in terms of their biological interpretation (reviewed in ref. 11).
We focused on two epigenetic clocks that apply to fibroblasts and
endothelial cells. In our primarily analysis, we used the pan-tissue
epigenetic clock3
because it applies to all sources of DNA (with the exception of sperm).
A previously defined mathematical algorithm is used to combine the
methylation levels of 353 CpG into an age estimate (in units of years),
which is referred to as epigenetic age or DNAm age3.
In our secondary analysis, we used the skin-and-blood epigenetic clock
(based on 391 CpGs) because it is known to lead to more accurate DNAm
age estimates in fibroblasts, keratinocytes, buccal cells, blood cells,
saliva, and endothelial cells13.
We used the online version of the epigenetic clock software to arrive at DNA methylation age estimates from n = 16 samples collected from n = 8 individuals3.
Although the chronological age range was relatively narrow (ranging
from 47 to 69 years, median age = 55), the two DNAm age estimates
exhibited moderately high correlations with chronological age (r = 0.42 and r = 0.63, P = 0.0089 for the pan-tissue- and the skin-and-blood clock, respectively).
Two samples (before and after rejuvenation treatment) were generated from each of n = 8
individuals. To properly account for the dependence structure in the
data, we used linear mixed effects models to regress DNAm age (dependent
variable) on treatment status, chronological age, and individual
identifier (coded as random effect). Toward this end, we used the “lmer”
function in the “lmerTest” R package41.
The data that support the findings of this study are
available from the corresponding author upon request. The data used for
the methylation clock analysis will be available through the following
GSE number starting April 08 2020: GSE142439.
RNASeq data have been deposited to the Sequence read Archive (SRA), and
will be available upon publication through the following SRA number: PRJNA598923.