Changing stroke rehab and research worldwide now.Time is Brain! trillions and trillions of neurons that DIE each day because there are NO effective hyperacute therapies besides tPA(only 12% effective). I have 523 posts on hyperacute therapy, enough for researchers to spend decades proving them out. These are my personal ideas and blog on stroke rehabilitation and stroke research. Do not attempt any of these without checking with your medical provider. Unless you join me in agitating, when you need these therapies they won't be there.

What this blog is for:

My blog is not to help survivors recover, it is to have the 10 million yearly stroke survivors light fires underneath their doctors, stroke hospitals and stroke researchers to get stroke solved. 100% recovery. The stroke medical world is completely failing at that goal, they don't even have it as a goal. Shortly after getting out of the hospital and getting NO information on the process or protocols of stroke rehabilitation and recovery I started searching on the internet and found that no other survivor received useful information. This is an attempt to cover all stroke rehabilitation information that should be readily available to survivors so they can talk with informed knowledge to their medical staff. It lays out what needs to be done to get stroke survivors closer to 100% recovery. It's quite disgusting that this information is not available from every stroke association and doctors group.

Tuesday, August 4, 2020

Persons post-stroke improve step length symmetry by walking asymmetrically

The discussion at the bottom tells us we still know nothing on what needs to be done for gait recovery.  And that will never be fixed until we get survivors in charge.

Persons post-stroke improve step length symmetry by walking asymmetrically

Abstract

Background and purpose

Restoration of step length symmetry is a common rehabilitation goal after stroke. Persons post-stroke often retain the ability to walk with symmetric step lengths (“symmetric steps”); however, the resulting walking pattern remains effortful. Two key questions with direct implications for rehabilitation have emerged: 1) how do persons post-stroke generate symmetric steps, and 2) why do symmetric steps remain so effortful? Here, we aimed to understand how persons post-stroke generate symmetric steps and explored how the resulting gait pattern may relate to the metabolic cost of transport.

Methods

We recorded kinematic, kinetic, and metabolic data as nine persons post-stroke walked on an instrumented treadmill under two conditions: preferred walking and symmetric stepping (using visual feedback).

Results

Gait kinematics and kinetics remained markedly asymmetric even when persons post-stroke improved step length symmetry. Impaired paretic propulsion and aberrant movement of the center of mass were evident during both preferred walking and symmetric stepping. These deficits contributed to diminished positive work performed by the paretic limb on the center of mass in both conditions. Within each condition, decreased positive paretic work correlated with increased metabolic cost of transport and decreased walking speed across participants.

Conclusions

It is critical to consider the mechanics used to restore symmetric steps when designing interventions to improve walking after stroke. Future research should consider the many dimensions of asymmetry in post-stroke gait, and additional within-participant manipulations of gait parameters are needed to improve our understanding of the elevated metabolic cost of walking after stroke.

Introduction

Gait dysfunction is common after stroke [1]. Persons post-stroke exhibit slow walking speeds [2,3,4], gait asymmetry [4, 5], and an elevated metabolic cost of transport (i.e., energy expended per meter walked) [6,7,8]. Gait training is a key component of stroke rehabilitation, as persons post-stroke frequently list gait improvement among their most desired rehabilitation goals [9].

Many rehabilitation approaches aim to restore step length symmetry [10,11,12,13,14,15,16]. The rationale for restoring step length symmetry is multifaceted: 1) asymmetric stepping increases the cost of transport in healthy adults [17], 2) persons post-stroke who walk with more asymmetric step lengths also tend to exhibit poorer balance [18] and more effortful gait patterns [19], 3) step length asymmetry is a simple metric that manifests from complex kinematic and kinetic asymmetries that can be difficult to treat in isolation, and 4) step length is easy to measure and manipulate in clinical settings (e.g., “step to the lines on the floor”). Consequently, there has been increasing interest in restoring step length symmetry after stroke, especially after recent intervention studies showed that improved step length symmetry coincided with improvements in gait speed [15] and cost of transport [19].

However, it is not clear that restoration of step length symmetry alone should lead to improvements in gait speed or cost of transport. Persons post-stroke often retain the capacity to walk with improved step length symmetry, even within a single testing session [16, 20, 21]. But unlike the intervention studies mentioned above, single-session studies have shown cost of transport to be similar whether persons post-stroke walk with asymmetric or symmetric step lengths [16, 21]. These findings suggest that improvements in gait speed and cost of transport likely arise from changes in kinematic or kinetic parameters that more directly influence gait speed or energetics and also affect step length symmetry. From this perspective, interventions that aim to restore step length symmetry but do not affect these critical underlying factors may not result in meaningful gait improvement. The ability to lessen cost of transport with an intervention aiming to restore step length symmetry likely depends on 1) the underlying causes of the asymmetry (which vary among patients [21, 22]), and 2) the mechanics used to generate the symmetric step lengths.

Here, we aimed to understand how persons post-stroke changed their walking patterns to restore step length symmetry and how these gait mechanics related to the cost of transport. We asked: do persons post-stroke restore step length symmetry by restoring symmetric gait mechanics or by relying on asymmetric compensatory mechanics? We hypothesized that persons post-stroke would restore step length symmetry using asymmetric walking patterns. We then aimed to explain why these asymmetric gait patterns cost so much energy despite improved step length symmetry.

Materials and methods

General methods

Ten persons post-stroke were recruited for the study. Data accrued from nine persons were retained for analysis (6 M/3F, age (mean ± SEM): 54 ± 4 years, lower extremity Fugl-Meyer [23]: 26 ± 1, body mass: 93 ± 6 kg, all > 6 months post-stroke). Inclusion criteria for recruitment included a step length difference of at least 2 cm during over-ground walking. One participant was excluded from analysis because they unexpectedly reduced the asymmetry below 2 cm during treadmill walking. All other participants showed a > 2 cm step length difference during both over-ground and treadmill walking and reduced their step length asymmetry from the preferred walking trial to the symmetric stepping trial. Participants reported no additional neurological, musculoskeletal, or cardiovascular conditions. We determined preferred walking speed as the average speed of three over-ground 10-meter walk tests (0.81 ± 0.09 m/s, range: 0.40–1.25 m/s). Seven participants held onto the treadmill handrails, two wore ankle-foot orthoses, and one received functional electrical stimulation of the tibialis anterior. We asked participants who held onto the handrails to hold onto them as little as possible and avoid gripping the handrail if at all possible. All participants wore a safety harness that did not provide body weight support, provided written informed consent in accordance with the Johns Hopkins Medicine Institutional Review board prior to participation, and received monetary compensation.

We recorded kinematic (100 Hz) and kinetic (1000 Hz) data using a three-dimensional motion capture system (Vicon, Oxford, UK) and instrumented split-belt treadmill (Motek, Amsterdam, NL; Fig. 1a, left). We placed retroreflective markers over the seventh cervical vertebrae, tenth thoracic vertebrae, jugular notch, xiphoid process, and bilaterally over the second and fifth metatarsal heads, calcaneus, medial and lateral malleoli, shank, medial and lateral femoral epicondyles, thigh, greater trochanter, iliac crest, and anterior and posterior superior iliac spines. We filtered marker trajectories and ground reaction forces (GRFs) with fourth order low-pass Butterworth filters (6 Hz and 15 Hz cut-off frequencies, respectively). GRFs were set to zero for vertical GRF magnitudes < 32 N. Participants wore comfortable shoes and form-fitting clothing.

Fig. 1
figure1

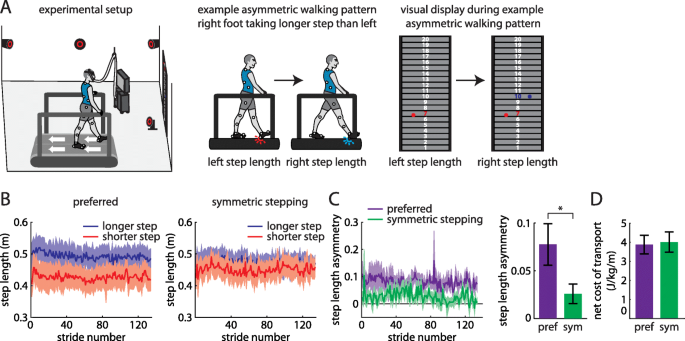
a Experimental setup (left). Example participant walking with asymmetric step lengths (center) and resulting visual display showing step length feedback bilaterally (right). b Step lengths (mean ± SE curves) for the limbs that took longer (blue) and shorter (red) steps at baseline during preferred walking (left) and symmetric stepping (right). The data shown have been truncated to number of strides for the participant that took the fewest strides for the same duration of the trial. c Step length asymmetry decreases significantly during symmetric stepping (green) as compared to preferred walking (purple). d The net metabolic cost of transport is similar between preferred walking and symmetric stepping

We collected metabolic data using a TrueOne 2400 system (Parvomedics, Sandy, UT) that warmed up for > 30 min before data collection and was calibrated to manufacturer specifications. We sampled oxygen consumption and carbon dioxide production breath-by-breath. We collected 2 minutes of baseline metabolic data during quiet standing. We used a traditional equation [24] to calculate total metabolic power during walking trials and subtracted baseline metabolic power to calculate net metabolic power. We calculated net metabolic cost of transport (herein referred to as cost of transport) by normalizing net metabolic power to treadmill speed.

Visual display

Our feedback display showed 20 vertically-arranged virtual targets on a 4 m × 2.5 m screen in front of the treadmill [16, 25]. The targets provided a reference frame for participant step lengths. Each target was 2.5 cm wide, and the step lengths associated with specific targets were adjusted for each participant’s preferred step lengths to ensure that the virtual step length markers never disappeared from the screen (i.e., spanned above or below the target board). For example, the step length associated with target “1” changed among participants depending on their step lengths, but all participants had to lengthen their step lengths by 2.5 cm to move a marker from target “1” to target “2”. Red and blue circles appeared on the left and right halves of the display, respectively, at heel-strikes (detected in real-time using force plates) to represent left and right step lengths (Fig. 1a, middle and right). The white number centered inside the target changed color (red at left heel-strike, blue at right heel-strike) when it had been reached with each foot.

Protocol

Participants performed three treadmill walking trials, each 4 minutes in duration, at preferred speeds. Participants first walked without feedback (baseline). This enabled us to measure baseline asymmetry and identify which leg took a longer step. We then displayed step length feedback, and participants walked with their preferred gait pattern or symmetric step lengths (order randomized). During preferred walking, participants received visual feedback about their step lengths but were not instructed to use the feedback and walked normally. During symmetric stepping, we asked participants to hit the same target with each pair of steps. We did not enforce constraints on individual step lengths or provide instructions about which leg should step longer or shorter to improve step length symmetry.

Spatiotemporal and kinematic measurements

We measured step length as the distance between the lateral malleoli markers along the anterior-posterior axis at heel-strike and step length asymmetry as the difference in consecutive step lengths between the leg that took a longer step at baseline and the leg that took a shorter step, normalized to their sum:

We also developed a measure of kinematic asymmetry – interlimb asymmetry (IA) - that was agnostic to each participant’s idiosyncratic gait deficits. This was important in enabling us to understand whether the participants improved step length symmetry with asymmetric kinematics without assigning the asymmetries to specific joints. Furthermore, we could determine whether the kinematic patterns used to improve symmetric step lengths were similar to participants’ preferred walking patterns.

IA quantifies asymmetry in individual limb segment contributions to step length. For example, consider a right step length of 0.5 m. If the distance between the left lateral malleolus and lateral femoral epicondyle markers is 0.05 m at right heel-strike, the trailing (left) shank segment contribution to step length is 0.05 m/0.5 m, or 0.10. These segment contributions were calculated along the anterior-posterior axis for the following segments and sum to 1:

  • trailing shank (trailing lateral malleolus to lateral femoral epicondyle, a)

  • trailing thigh (trailing lateral femoral epicondyle to greater trochanter, b)

  • trailing pelvis (trailing greater trochanter to iliac crest, c)

  • trailing contribution from pelvic rotation (trailing iliac crest to center of pelvis, d)

  • leading contribution from pelvic rotation (center of pelvis to leading iliac crest, e)

  • leading pelvis (leading iliac crest to greater trochanter, f)

  • leading thigh (leading greater trochanter to lateral femoral epicondyle, g)

  • leading shank (leading lateral femoral epicondyle to lateral malleolus, h)

We calculated IA by summing the segment asymmetries between the left (l) and right (r) legs at consecutive heel-strikes (i.e., absolute values of the differences between each segment contribution bilaterally):

IA is bounded between 0 (completely symmetric segment contributions) and 2 (completely asymmetric segment contributions). This metric can remain constant across different step lengths as long as the segment contributions scale proportionally.

Kinetic measurements

We calculated the instantaneous center of mass (COM) mechanical power using the individual limbs method [26] as has been done previously in persons post-stroke [27, 28]. This method assumes a mechanical model of gait that allows for calculation of instantaneous COM power generated by each leg as the dot product of the GRF vector of each leg and the COM velocity vector [26]. We performed these calculations for the last five strides of each condition that exhibited clean force plate strikes (i.e., each foot landed on a different force plate). Each stride began with a paretic limb heel-strike. We partitioned each stride into four periods (two step-to-step transition periods and two non-transition periods) based on time points when the COM velocity vector was redirected within the sagittal plane [29]. The onset of the first period was considered the cessation of the fourth period of the previous stride. We calculated the positive and negative work done on the COM by each limb during the four periods by integrating the positive and negative portions of the power curve within each period. All kinetic measures were normalized to body mass.

Data analysis

We averaged step length asymmetry, individual step lengths, IA, and segment asymmetries across the four-minute trial for each participant and condition. We calculated cost of transport over the final minute of each trial to ensure steady state measurement. In our GRF and COM velocity analyses, we set the anterior-posterior (AP) axis to be positive in the forward direction, mediolateral (ML) axis to be positive in the direction from the paretic limb toward the nonparetic limb, and vertical axis to be positive upward. We calculated GRF peaks as the most positive values produced along each axis by each leg (except the nonparetic ML GRF peak, which was calculated as the most negative value) stride-by-stride over the final five clean strides. We identified peak COM velocities at two time points. We calculated peak AP and vertical COM velocities as the most positive velocities observed when the corresponding GRF magnitude was also positive. We calculated peak ML COM velocities as the most positive COM velocity when the paretic ML GRF was positive (paretic) and the most negative velocity when the nonparetic ML GRF was negative (nonparetic). We calculated positive and negative work done by each limb during each of the four gait cycle periods stride-by-stride over the final five clean strides and then averaged across strides for each participant and condition. We also calculated total positive and negative work done by each limb across the gait cycle stride-by-stride over the final five clean strides and then averaged across strides for each participant and condition.

Statistical analysis

We performed paired t-tests to compare step length asymmetry, cost of transport, and IA between conditions (preferred walking and symmetric stepping) and step length symmetry with and without feedback. We performed a 2 × 2 step (shorter, longer) x condition (preferred walking, symmetric stepping) repeated measures ANOVAs to compare changes in step lengths. We performed a 7 × 2 limb segment (a through h as described above, with d and e summed to indicate pelvic rotation) x condition repeated measures ANOVA to compare segment asymmetry among segments and between conditions. We performed 2 × 2 leg (paretic, nonparetic) x condition repeated measures ANOVAs to compare GRF peaks, COM velocity peaks, and positive and negative work done across legs and conditions. We performed Pearson’s correlations to assess the following relationships: step length symmetry vs. cost of transport, IA during preferred walking vs. IA during symmetric stepping, IA vs. cost of transport, cost of transport vs. positive paretic and nonparetic work, preferred walking speed vs. positive paretic and nonparetic work, and IA vs. positive paretic and nonparetic work. We set α ≤ 0.05, performed Mauchly’s tests of sphericity (Greenhouse-Geisser corrections were applied when sphericity was violated), and applied post hoc corrections for multiple comparisons where appropriate (Bonferroni for analyses with three comparisons, Dunn-Sidak otherwise).

Results

Persons post-stroke can walk with more symmetric step lengths, but this does not change the cost of transport

All participants walked with asymmetric step lengths during preferred walking (Fig. 1b, left) and successfully adjusted their step lengths during the symmetric stepping condition (Fig. 1b, right) to reduce step length asymmetry (t (8)=3.99, p < 0.01; Fig. 1c). When comparing step lengths across leg and conditions, we expectedly observed a significant main effect of leg (F (1, 8)=18.264, p = 0.003) and a significant interaction (F (1, 8)=33.72, p < 0.001). Post-hoc analyses revealed that there was a significant increase in step length in the shorter limb (p = 0.02) and a significant decrease in step length in the longer limb (p = 0.04) from the preferred to symmetric stepping conditions. We replicated prior findings [16, 21] showing that improving step length symmetry with visual feedback had no significant effect on cost of transport (t (8)=0.92, p = 0.38; Fig. 1d). Furthermore, when comparing the preferred walking trials with feedback off versus feedback on, the presence of visual feedback did not affect step length asymmetry (t (8)=0.07, p = 0.95) or metabolic cost (t (8)=0.49, p = 0.64). Importantly, we also did not observe any between-participant correlation between step length symmetry and increased cost of transport in either condition (preferred walking, r = − 0.22, n = 9, p = 0.53; symmetric walking, r = − 0.32, n = 9, p = 0.36).

Persons post-stroke exhibit marked IA even when walking with symmetric step lengths

A conceptual illustration of how we expected IA may differ between healthy symmetric walking and symmetric stepping after stroke is shown in Fig. 2a. We hypothesized that healthy walking consists of symmetric step lengths and similar contributions of each segment to step lengths bilaterally, resulting in small IA (Fig. 2a, left). On the contrary, we expected that symmetric stepping after stroke consists of symmetric step lengths but asymmetric segment contributions, resulting in high IA (Fig. 2a, right).

Fig. 2
figure2

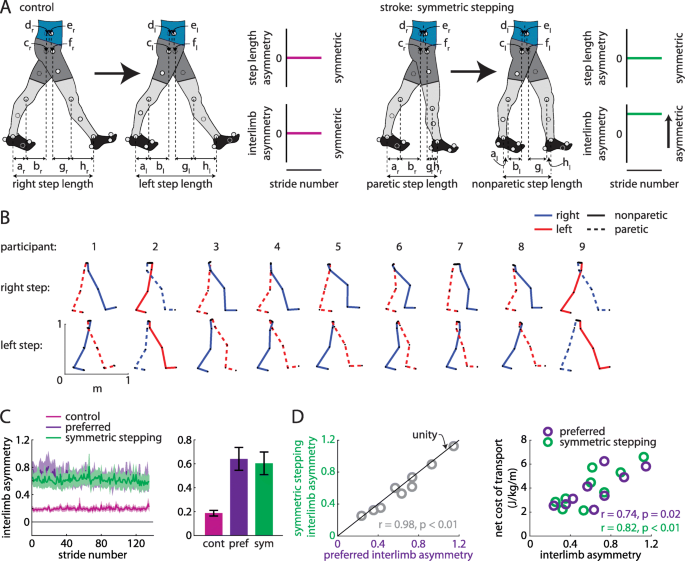
a Hypotheses regarding walking patterns used by control (healthy young adults) and persons post-stroke to achieve step length symmetry. We hypothesized that healthy adults achieve step length symmetry using symmetric kinematics (as represented by small interlimb asymmetry (IA); left) and persons post-stroke achieve step length symmetry using asymmetric kinematics (large IA; right). b Limb orientations (blue = right, red = left, solid = nonparetic, dashed = paretic) during representative steps for each participant. c Persons post-stroke show marked IA during preferred walking and symmetric stepping (mean ± SEM). Control data shown for reference. d IA during symmetric stepping correlates strongly with IA during preferred walking in persons post-stroke (left). Net metabolic cost of transport correlates strongly with IA during preferred walking and symmetric stepping (right)

We show the limb segment orientations during representative steps of symmetric stepping for each participant (Fig. 2b). We did not observe a significant reduction in IA during symmetric stepping as compared to preferred walking (t (8)=2.12, p = 0.066; Fig. 2c). While it is possible that there is a trend toward a mild decrease in IA with symmetric step lengths, IA during symmetric stepping remained markedly increased when compared to healthy symmetric gait (for reference, data from eight healthy adults (age: 26 ± 5 years) walking at 1.25 m/s are shown in Fig. 2c). IA during preferred walking correlated strongly with IA during symmetric stepping (r = 0.98, n = 9, p < 0.01; Fig. 2d, left) and, qualitatively, the data fell near the unity line (Fig. 2d, left), suggesting that persons post-stroke showed similar IA during preferred walking and symmetric stepping. IA was significantly associated with cost of transport during preferred walking (r = 0.74, n = 9, p = 0.02) and symmetric stepping (r = 0.82, n = 9, p < 0.01; Fig. 2d, right), suggesting that kinematic asymmetries are correlated with cost of transport regardless of step length asymmetry.

We next considered that IA could remain similar across conditions while individual segment asymmetries could be reorganized. We did not find this to be the case. We compared the individual segment asymmetries (e.g., |al, lhs − ar, rhs|) across segments and between conditions. ANOVA revealed a significant main effect of segment (F(2.312,18.497) = 4.87, p = 0.017). Post hoc analyses revealed that segment asymmetry was significantly larger in pelvic rotation (d + e) than both leading (f; p = 0.022) and trailing pelvis translation (c; p = 0.023). We did not observe a significant main effect of condition (F (1, 8)=4.49, p = 0.067; Fig. 3a) or segment x condition interaction (F(2.03,16.25) = 0.6, p = 0.49). Figure 3b and c show how the segment asymmetries contribute to IA for each participant during each condition. When we compared segment asymmetries after ordering them by which contributed most-to-least strongly to IA (during preferred walking) between conditions, we also did not observe a significant main effect of condition (F (1, 8)=4.49, p = 0.067; Fig. 3d) or segment x condition interaction (F(2.5,19.98) = 2.153, p = 0.134). As expected, we observed a significant main effect of segment (F(1.5,12.06) = 28.38, p < 0.001).

Fig. 3
figure3

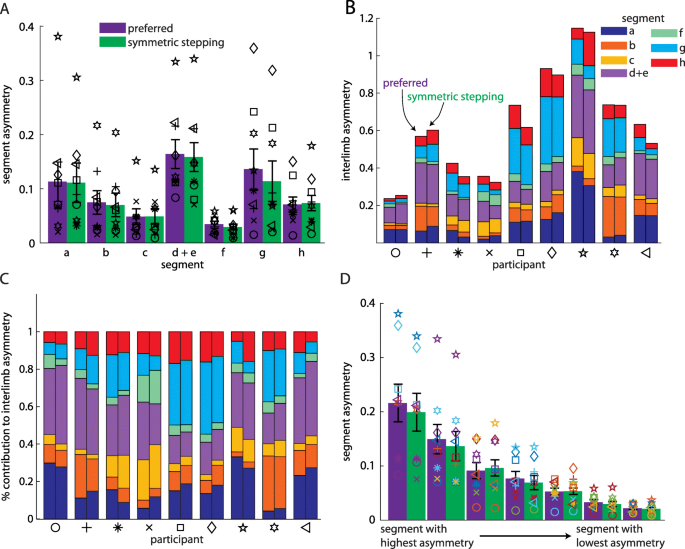
a Asymmetries in individual segment contributions to IA during preferred walking and symmetric stepping (organized by segment; mean ± SEM). Symbols represent individual participants. b Individual segment contributions to IA during preferred walking and symmetric stepping (organized by participant). For each pair of bars, the preferred walking data are represented by the left bar and the symmetric stepping data by the right. c Individual segment contributions to IA during preferred walking and symmetric stepping shown as a percentage of IA. d Asymmetries in individual segment contributions to IA during preferred walking and symmetric stepping (segments organized from highest asymmetry to lowest asymmetry). Symbols follow same scheme as in a-c and symbol colors follow the same scheme as in b and c

Asymmetries in AP GRFs, ML GRFs, and vertical COM velocities observed during preferred walking persist during symmetric stepping

We then aimed to identify the features of these asymmetric walking patterns that may influence the elevated cost of transport regardless of step length asymmetry. We investigated whether these features were similar in both preferred walking and symmetric stepping, or whether the costs of transport were similarly high in these conditions but resulted from different underlying mechanics. Asymmetric kinematics at heel-strike should result in asymmetric mechanical work done on the COM by each leg, and previous studies demonstrated that mechanical work done on the COM is related to cost of transport in healthy adults [26, 30]. Furthermore, prior studies identified periods of the gait cycle where excessive positive work is often observed post-stroke, contributing to an elevated mechanical energetic cost [7, 8, 31].

We investigated GRF and COM velocity profiles between legs and conditions, as these contribute to the work done over the gait cycle. ANOVA revealed a main effect of leg on the AP GRF peak (Fig. 4a and b, top; F (1, 8)=10.29, p = 0.01), ML GRF peak (Fig. 4a and b, middle; F (1, 8)=7.55, p = 0.03), AP COM velocity peak (Fig. 4c and d, top; F (1, 8)=8.53, p = 0.02), and vertical COM velocity peak (Figs. 4c and d, bottom; F (1, 8)=6.63, p = 0.03). Post hoc analyses revealed that the AP GRF peak was significantly larger in the nonparetic leg than the paretic leg (p = 0.01), the ML GRF peak was significantly larger in the paretic leg than the nonparetic leg (p = 0.03), the AP COM velocity peak was significantly larger during nonparetic late stance as compared to paretic late stance (p = 0.02), and the vertical COM velocity peak was significantly larger during paretic late stance as compared to nonparetic late stance (p = 0.03). There were no significant effects of leg on the vertical GRF peak (F (1, 8)=0.43, p = 0.53) or ML COM velocity peak (F (1, 8)=2.80, p = 0.13). We did not observe significant effects of condition on GRF or COM velocity variables (all p > 0.17) or leg x condition interactions (all p > 0.31).

Fig. 4
figure4

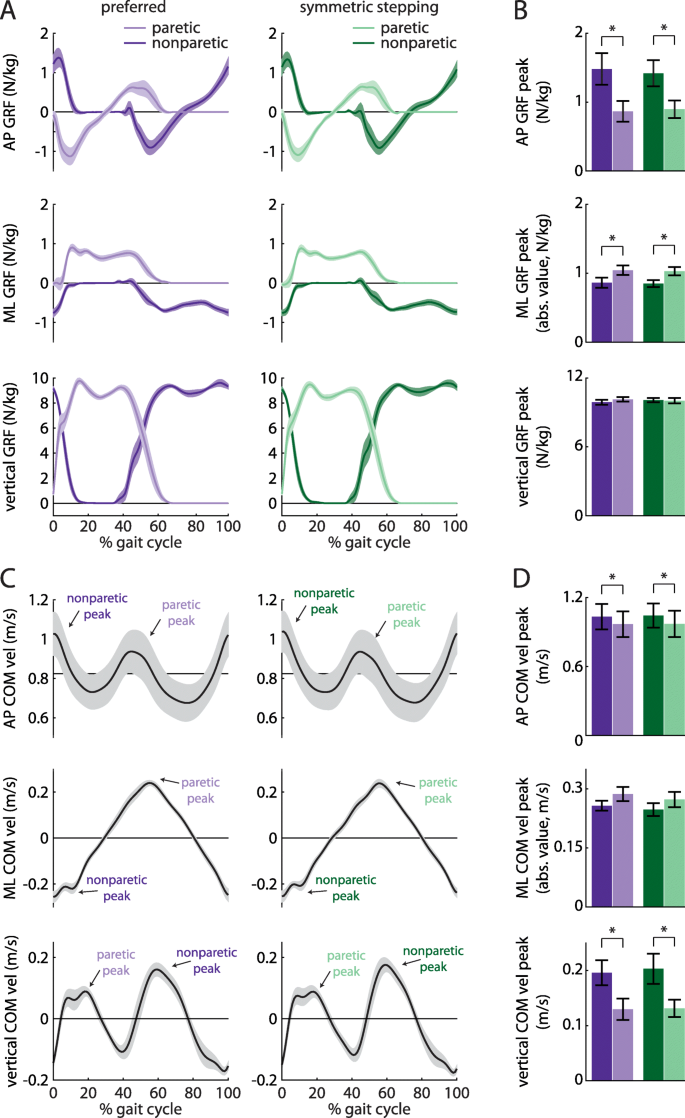
a Anterior-posterior (AP; top), mediolateral (ML; middle), and vertical (bottom) ground reaction force (GRF) profiles for the paretic (light colors) and nonparetic (dark colors) limbs during preferred walking (purple) and symmetric stepping (green). The gait cycle is aligned to paretic heel-strike. Persons post-stroke show decreased peak AP force production and increased peak ML force production in the paretic limb during both conditions. b Summary data for GRF peaks showing mean ± SEM. c AP (top), ML (middle), and vertical (bottom) center of mass (COM) velocity profiles during preferred walking and symmetric stepping. Peaks are labeled ‘paretic’ or ‘nonparetic’ based on the leg that most strongly contributed to the velocity. Persons post-stroke show increased AP and vertical COM velocity during late paretic stance as compared to late nonparetic stance during both conditions. d Summary data for COM velocity peaks showing mean ± SEM. *p < 0.05 between limbs

The nonparetic leg does more positive work than the paretic leg during preferred walking and symmetric stepping

We next investigated the work done on the COM by each leg across conditions. We first calculated COM power for each leg during preferred walking and symmetric stepping (Fig. 5a). We calculated COM work by integrating COM power over each of the four time periods described in the methods (Fig. 5b and c). ANOVA revealed a significant main effect of leg on positive work done 1) by the paretic leg during the first period (step-to-step transition, nonparetic leg trailing) vs. the nonparetic leg during the third period (step-to-step transition, paretic leg trailing; F (1, 8)=10.96, p = 0.01), and 2) by the paretic leg during the second period (paretic single support) vs. the nonparetic leg during the fourth period (nonparetic single support; F (1, 8)=11.85, p < 0.01). Post hoc analyses revealed that the nonparetic leg did significantly more positive work during the third period than the paretic leg did during the first period (p = 0.01). The nonparetic leg also did significantly more positive work during the fourth period than the paretic leg did during the second period (p < 0.01).

Fig. 5
figure5

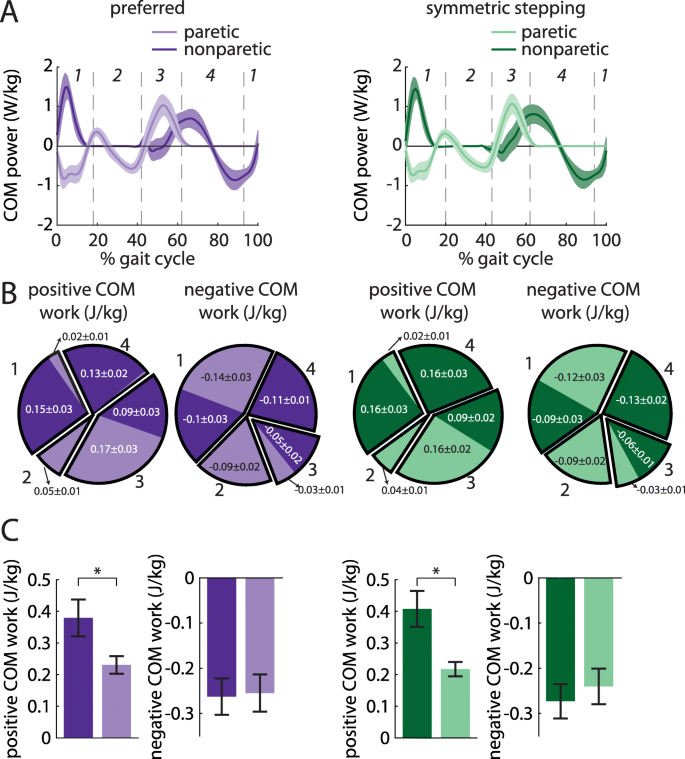
a COM power (mean ± SEM) generated by the paretic (light colors) and nonparetic (dark colors) limbs during preferred walking (left) and symmetric stepping (right). Gait cycles are aligned to paretic heel-strike and partitioned into four periods defined by changes in direction of the COM velocity vector within the sagittal plane. b Positive and negative COM work (mean ± SEM) performed by each limb in the four periods during preferred walking (left) and symmetric stepping (right). Pie charts display fractions of overall positive or negative work during each period in each condition. Numerical labels on individual limb work contributing to less than 1% of total mechanical work in each condition and results of statistical analyses are omitted for clarity. c Total positive and negative COM work (mean ± SEM. *p < 0.05 between limbs) performed by each limb across all four periods during preferred walking (left) and symmetric stepping (right). Persons post-stroke perform more positive work with the nonparetic limb than the paretic limb during both conditions

ANOVA also revealed a significant main effect of leg on negative work done 1) by the paretic leg during the first period (step-to-step transition, nonparetic leg trailing) vs. the nonparetic leg during the third period (step-to-step transition, paretic leg trailing; F (1, 8)=6.35, p = 0.04), and 2) by the paretic leg during the third period vs. the nonparetic leg during the first period (F (1, 8)=7.06, p = 0.03). Post hoc analyses revealed that the paretic leg did significantly more negative work during the first period than the nonparetic leg did during the third period (p = 0.04). However, the nonparetic leg did significantly more negative work during the first period than the paretic leg did during the third period (p = 0.03). Note on Fig. 5a that the first transition period begins prior to paretic heel-strike at approximately 95% of the prior gait cycle.

We did not observe a significant main effect of condition on work done over any of the time periods (all p > 0.13). We did observe a significant leg x condition interaction for the positive work done during the fourth period (nonparetic single support; F (1, 8)=7.43, p = 0.03); however, post hoc analyses did not reach statistical significance.

A separate ANOVA revealed a significant main effect of leg on positive (but not negative; F (1, 8)=0.03, p = 0.87) work done across all time periods (F (1, 8)=7.25, p = 0.03). We did not observe a significant main effect of condition on positive or negative work done across all time periods (both p > 0.57) nor did we observe a significant leg x condition interaction on positive or negative work done across all periods (both p > 0.10).

Less positive work done by the paretic leg is correlated with higher cost of transport and slower walking

We then assessed whether the positive and negative work done by each leg across the gait cycle were correlated with cost of transport, gait speed, or IA during preferred walking and symmetric stepping. Positive paretic work was significantly correlated with decreased cost of transport during both conditions (preferred walking: r = − 0.84, p < 0.01; symmetric stepping: r = − 0.80, p < 0.01; Fig. 6a, left); positive nonparetic work was not (both p > 0.63, Fig. 6a, right). Positive paretic work was also significantly correlated with increased walking speed (preferred walking: r = 0.90, p < 0.01; symmetric stepping: r = 0.87, p < 0.01; Fig. 6b, left) whereas positive nonparetic work was not (both p > 0.66, Fig. 6b, right). Finally, positive paretic work was negatively correlated with decreased IA during preferred walking and symmetric stepping, though these trends did not reach statistical significance (preferred walking: r = − 0.62, p = 0.07; symmetric stepping: r = − 0.65, p = 0.06; Fig. 6c, left). Positive nonparetic work was not significantly correlated with IA during either condition (both p > 0.50; Fig. 6c, right). We did not observe significant correlations between negative paretic or nonparetic work and cost of transport, walking speed, or IA during either condition (all p > 0.10).

Fig. 6
figure6

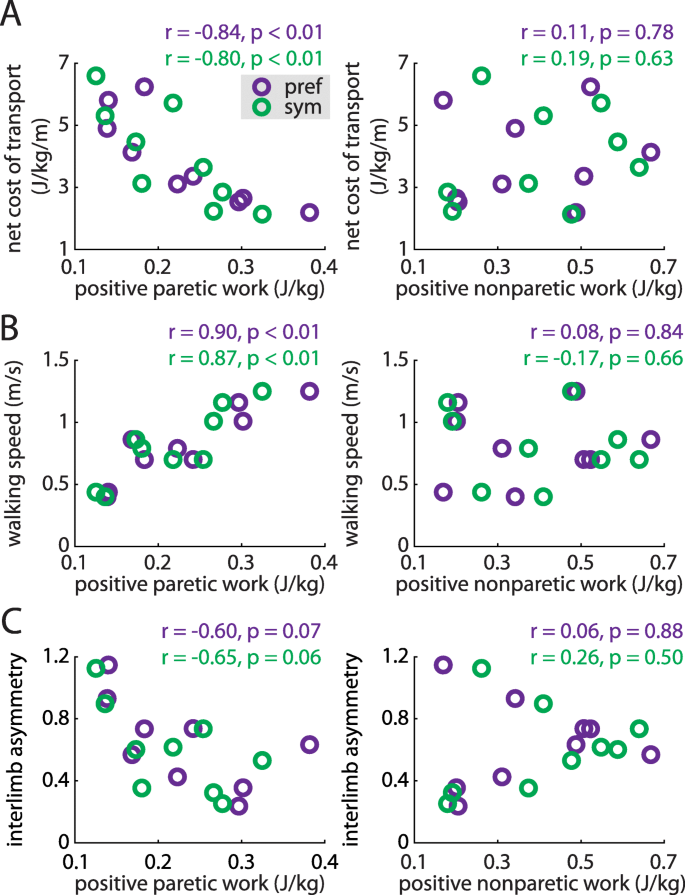
Positive paretic work correlates strongly with the net metabolic cost of transport (a, left), walking speed (b, left) during both preferred walking (purple) and symmetric stepping (green). The correlation between positive paretic work and IA shows a similar trend but is not statistically significant in either condition (c, left). Positive nonparetic work is not significantly associated with any of these variables (a, b and c, right) during either condition

Discussion

Gait kinematics, kinetics, and cost of transport changed very little when persons post-stroke used visual feedback to improve step length symmetry. Although participants were not provided specific instructions on how to change their step lengths to attain symmetry, participants significantly lengthened the shorter step and shortened the longer step to improve step length symmetry. Even when walking with more symmetric steps, participants exhibited considerable kinematic asymmetry, impaired paretic propulsion during late paretic stance, and excessive compensatory vertical movement of the COM during late paretic stance and nonparetic single support [4, 31, 32]. Deficits in positive paretic work were also unaffected by improvement in step length symmetry and were correlated with cost of transport and walking speed. These findings reveal that step length symmetry improvement does not necessarily result in positive changes elsewhere in the gait pattern after stroke. It is critical that interventions do not merely aim to restore step length symmetry but rather address the underlying impairments in gait mechanics and/or control.

We do not necessarily intend for these findings to be interpreted as an indictment on step length asymmetry as a target of post-stroke gait rehabilitation. Interventions that improve step length asymmetry have shown coincident improvement in gait speed [15] and decreased cost of transport [19]. However, step length asymmetry arises from a complicated series of deficits [4, 5, 22]. We propose that it is not so important that step length symmetry is restored, but rather how step length symmetry is restored – i.e., how underlying deficits in kinematics, kinetics, or muscle activation that cause step length asymmetry are addressed – that will facilitate gait improvement more broadly. For example, interventions that restore step length symmetry by improving paretic propulsion [19] have shown potential for driving meaningful improvement in post-stroke gait. Furthermore, in this study, persons post-stroke tended to improve step length symmetry by simultaneously shortening the longer step and lengthening the shorter step. In clinical practice, shortening the longer step is unlikely to be a relevant goal. Lengthening the shorter step may have different biomechanical and metabolic consequences than shortening the longer step [21], and it will be important for future studies to examine these effects.

How might we design interventions to restore step length symmetry and decrease cost of transport? The between-participant correlational analyses showing positive paretic work to be correlated with cost of transport and gait speed (and, to a lesser extent, IA) do not establish causal relationships between these variables. However, they do highlight positive paretic work as an important topic of future investigation. Although mechanical work is not related to the cost of transport in all walking conditions [33], a substantial portion of the cost of transport can be attributed to the mechanical work generated by the legs on the COM during step-to-step transitions [26, 34,35,36]. Persons post-stroke generate more positive work with the nonparetic leg than the paretic leg [4, 27, 28, 31, 37], and this deficit is influenced by the lack of sufficient paretic propulsion during the step-to-step transition occurring during late paretic stance [32, 38]. Importantly, this propulsion must also occur at the appropriate timing [39]. Interventions that improve paretic propulsion and extend paretic stance may then enhance the ability of the paretic leg to generate positive work and facilitate a faster, more symmetric, less effortful walking pattern.

How might we reconcile the inability to generate positive paretic work with an increase in cost of transport after stroke? Prior studies have explained how the reduced positive work generated via paretic propulsion reverberates throughout the walking pattern. Paretic stance time is shortened relative to nonparetic stance [4], and impaired paretic propulsion decreases the energy transmitted to the leg to initiate swing [31, 40,41,42]. This necessitates compensatory mechanics to facilitate paretic leg swing. Often, vaulting (vertical COM movement generated primarily by the nonparetic leg) occurs to lift the paretic foot from the floor. This elevates vertical COM velocity and increases the positive work done to raise the COM (rather than direct it forward) during late paretic stance [8, 27, 28, 31]. Persons post-stroke then often use a sequence of pelvic rotation, hip hiking, and hip circumduction to swing the leg and clear the foot [4, 31]. This slow paretic leg swing prolongs nonparetic stance, increasing the positive nonparetic work done during single support [8].

The inability to generate sufficient paretic propulsion during late stance thus requires 1) increased positive nonparetic work during single support and late paretic stance, often in the vertical direction, or 2) compensatory demands on the nonparetic leg that can be lessened by decreasing gait speed [43]. Either of these factors could result in an elevated cost of transport, and the altered mechanics persisted across both preferred walking and symmetric stepping. Fortunately, many interventions – including fast walking [44,45,46], functional electrical stimulation of the plantarflexors [46], and split-belt treadmill walking [20, 47] – show promise for improving paretic propulsion [38]. These interventions target paretic propulsion through combinations of improving ankle power generation and increasing paretic limb extension during late stance (i.e., trailing limb angle [41, 48]). Improving propulsion by increasing ankle power is also a common goal in robotic designs [39, 49,50,51], and multiple interventions that target paretic propulsion have resulted in improved step length symmetry [11, 19].

Our study was not without limitations. We focused on the relationship between step length symmetry and cost of transport during only a single testing session and only by using visual feedback to improve step length symmetry. Improved step length symmetry without changes in the underlying gait mechanics may affect cost of transport differently if the improved symmetry is achieved via long-term training. The participants included here exhibited mild-to-moderate gait dysfunction and were in the chronic phase post-stroke. These results may not extrapolate to more impaired patients or patients in the acute phase post-stroke. While participants were instructed to avoid holding the handrails as much as possible during the task, not all participants were able to do so. We did not use instrumented handrails and could not quantify the impact of holding on to the handrails on IA or mechanical work done.

Summary

Persons post-stroke improve step length symmetry using energetically expensive, asymmetric walking patterns that are largely similar to their preferred gait. The similarity in cost of transport observed during preferred walking and symmetric stepping can be explained by the persistence of aberrant gait mechanics (specifically, impaired ability to generate positive paretic work) regardless of step length symmetry. Our findings suggest that future interventions should target the gait deficits that underlie step length asymmetry rather than step length asymmetry in isolation.

Next-generation Mobile Stroke Unit under development

And just why would you go with something this slow?

Next-generation Mobile Stroke Unit under development

Work is underway to create the next-generation Mobile Stroke Unit (MSU-2) to provide more Australians with rapid access to real-time stroke treatment.

The development of designs for the next-generation stroke ambulance is part of the funding provided by the federal government in the Medical Research Future Fund (MRFF).

The project involves the partners that led the delivery of Australia’s first MSU, The Royal Melbourne Hospital (RMH), the Stroke Foundation, the University of Melbourne and Ambulance Victoria (AV), who now join 30 other health and academic partners.

Together, these partners form the Australian Stroke Alliance, the largest network of its kind, committed to developing cutting edge technologies to provide pre-hospital stroke care to all Australians.

The MSU-2 design plans are part of a co-creation partnership with Siemens Healthineers, and will feature the latest imaging and telehealth technologies to enable the best and most up-to-date prehospital stroke care available.

The original Melbourne MSU, housed at the RMH and the first of its kind in Australia, is an outstanding success(Really! How many 100% recovered? Quit using the tyranny of low expectations to justify your failures.) . The MSU attended 1035 patients in its first two years of operation, providing treatment at the scene 61 minutes faster compared with patients taken to hospital for treatment.

Co-chair of the Australian Stroke Alliance, Professor Stephen Davis, said the results were extremely impressive, considering every minute counts when it comes to stroke. The new MSU will allow even more accurate diagnosis.

“This is an exciting new design and a great step forward in providing the best stroke care for all Australians,” Prof Davis said.

“This is the world’s first purpose-built scanner for the mobile environment enabling even more accurate and detailed diagnostic brain imaging.”

“With the new MSU-2, stroke patients will have the specialty treatments they need much sooner, minimising risk of disability.”

Stroke is a leading cause of disability in Australia. It is estimated that 1.9 million neurons, 14 billion synapses and 12km of myelinated fibres are destroyed each minute of an ischemic stroke.

Alliance co-chair, Professor Geoffrey Donnan, said with stroke being a leading cause of disability in Australia, the possibility of the MSU-2 and other projects (proposed as part of the Medical Research Future Fund Frontier program) means more Australians are likely to recover well from this devastating condition.

“The focus of the MRFF project is in the development, testing and implementation of portable brain imaging tools in air and road ambulances,” Professor Donnan said.

“These projects are all about treating stroke during the ‘golden-hour’ – the crucial first hour of a stroke when patients have a greater chance of avoiding long-term damage.

“With the MSU-2 and other projects, we are able to look at the possibility of treating more patients within that golden-hour, like we have successfully shown with the original Melbourne MSU,” Professor Donnan said.

Ambulance Victoria’s Executive Director of Clinical Operations, Mick Stephenson said the Mobile Stroke Unit makes a big difference to patient outcomes and quality of life.

“We’re able to start working on a patient immediately by providing specialist care which means we’re reducing the time waiting for hospital treatment,” Associate Professor Stephenson said.

“Providing Victorians the right care at the right time, no matter where they live, is at the heart of everything we do. The MSU is a key component of Victoria’s world-class integrated stroke network and we are excited to be partnering in its further development.”

Medical technology company, Siemens Healthineers is partnering with the Australian Stroke Alliance to develop and design the next generation MSU.

“Siemens Healthineers are privileged and excited to be working with the Australian Stroke Alliance in the transformation of stroke care delivery,” said Philipp Fischer, Head of Computed Tomography. “Our collective aim is to enhance clinical outcomes, and cost effectiveness of MSU services for healthcare providers across Australia.”

Media liaison:

Australian Stroke Alliance Amanda Place 0411 204 526 aplace@unimelb.edu.au

Royal Melbourne Hospital Rose Houghton 0431 481 588 rose.houghton@mh.org.au

Siemens Healthineers Sam Gallagher sam.gallagher@siemens-healthineers.com

The Plan - Australia Stroke Alliance

YOU HAVE TO GET INVOLVED. This plan diagnoses stroke way too slow and expensive. This is what happens when you have fossilized thinking, and stroke survivors will bear the brunt of this failure.

The Plan - Australia Stroke Alliance

This growing collaboration is committed to build on the successes of phase one. We are strapping in to bring the Stroke Golden Hour to Australia’s roads and skies.

Working with partners like the Royal Flying Doctors Service and engineers from RMIT University, we plan to develop air mobile stroke units for use in aircraft and helicopters.

This will require the design of ultra-lightweight and low-cost brain imaging devices that will provide essential images of patients’ brains. during flight.(This assumes you need neurologists to diagnose stroke. DO YOU?)

Regardless of geographical location, images would then be sent immediately so city-based stroke physicians can diagnose the type of stroke that has occurred – within minutes. This overcomes a major gap in care as stroke physicians are rarely located in rural hospital settings.

The new brain imaging devices will drive enormous growth in medical technologies and healthcare industries in both Australia and potentially globally.

It would truly be such a game changer for Central Australian stroke management. Our catchment area is huge (>1,000,000 km2) – from Elliot in the north, down to near Coober Pedy in the South, over into the Western desert regions of WA and over the border of Queensland… making distance and time major issues for timely stroke management.”

– Dr Anna Holwell, GP, Northern territory


Funding of the Stroke Golden Hour:

Deloitte Economics has found that the economic burden of stroke is set to soar unless Australia addresses the pending crisis.

In 2017-2018, stroke cost $5 billion per annum. By 2050, the burden will escalate to $10 billion per year.

An investment of $100 million by the Medical Research Future Fund now will reap savings of $400 million per annum and $12 billion by 2050. This equates to an investment of <0.001% relative to costs.

Australian Stroke Alliance: Economic Benefits

Our Story

The Plan

Blood biomarkers for the diagnosis and differentiation of stroke: A systematic review and meta-analysis

And just why would you want a 24 hour blood test?

Blood biomarkers for the diagnosis and differentiation of stroke: A systematic review and meta-analysis

First Published August 3, 2020 Review Article 

Correct diagnosis of stroke and its subtypes is pivotal in early stages for optimum treatment.

The aim of this systematic review and meta-analysis is to summarize the published evidence on the potential of blood biomarkers in the diagnosis and differentiation of stroke subtypes.

A literature search was conducted for papers published until 20 April 2020 in PubMed, EMBASE, Cochrane Library, TRIP, and Google Scholar databases to search for eligible studies investigating the role of blood biomarkers in diagnosing stroke. Quality assessment was done using modified Quality Assessment of Diagnostic Accuracy Studies questionnaire. Pooled standardized mean difference and 95% confidence intervals were calculated. Presence of heterogeneity among the included studies was investigated using the Cochran's Q statistic and I2 metric tests. If I2 was < 50% then a fixed-effect model was applied else a random-effect model was applied. Risk of bias was assessed using funnel plots and between-study heterogeneity was assessed using meta-regression and sensitivity analyses. Entire statistical analysis was conducted in STATA version 13.0.

A total of 40 studies including patients with 5001 ischemic strokes, 756 intracerebral hemorrhage, 554 stroke mimics, and 1774 healthy control subjects analyzing 25 biomarkers (within 24 h after symptoms onset/after the event) were included in our meta-analysis; 67.5% of studies had moderate evidence of quality. Brain natriuretic peptide, matrix metalloproteinase-9, and D-dimer significantly differentiated ischemic stroke from intracerebral hemorrhage, stroke mimics, and health control subjects (p < 0.05). Glial fibrillary acidic protein successfully differentiated ischemic stroke from intracerebral hemorrhage (standardized mean difference −1.04; 95% confidence interval −1.46 to −0.63) within 6 h. No studies were found to conduct a meta-analysis of blood biomarkers differentiating transient ischemic attack from healthy controls and stroke mimics.

This meta-analysis highlights the potential of brain natriuretic peptide, matrix metalloproteinase-9, D-dimer, and glial fibrillary acidic protein as diagnostic biomarkers for stroke within 24 h. Results of our meta-analysis might serve as a platform for conducting further targeted proteomics studies and phase-III clinical trials.

PROSPERO Registration ID: CRD42019139659.

Monday, August 3, 2020

Clinical Utility and Cost of Inpatient Transthoracic Echocardiography Following Acute Ischemic Stroke

Where the fuck is the protocol located? Because if survivors don't bring it to our hospitals' attention it will never get implemented. 

Clinical Utility and Cost of Inpatient Transthoracic Echocardiography Following Acute Ischemic Stroke


First Published July 31, 2020 Research Article


It is unclear whether it is clinically necessary or cost-effective to routinely obtain a transthoracic echocardiogram (TTE) during inpatient admission for ischemic stroke.

We assessed consecutive patients presenting with acute ischemic stroke at a comprehensive stroke center from 2015 to 2017 who underwent TTE. We assessed for findings on TTE that would warrant urgent intervention including cardiac thrombus, atrial myxoma, mitral stenosis, valve vegetation, valve dysfunction requiring surgery, and low ejection fraction. Subsequent changes in management included changes in anticoagulation, antibiotics, or valve surgery. We calculated in-hospital resource utilization and associated costs for inpatient TTE using individual direct cost details within a case-costing system.

Of 695 patients admitted with acute ischemic stroke, 516 (74%) had a TTE and were included in our analysis. TTE findings were potentially clinically significant in 30 patients (5.8%) and changed management in 17 patients (3.3%). Inpatient admission was prolonged to expedite TTE in 24 patients, while TTE occurred after discharge in 76 patients. After correcting for the cost of TTE, the mean difference in cost to prolong an admission for TTE was $555.52 (USD), or $16 832 per change in management.

Given the low clinical utility of inpatient TTE after acute ischemic stroke and the costs associated with prolonging admission, discharge from hospital should not be delayed solely to obtain TTE.

Recumbent tricycle learnings#1

One of my front tires would only hold air for an hour ride. I assumed I would just take off the wheel and replace the tube inside my apartment. Nope, the wheel does not come off. So I popped one side off with my plastic tire irons, pulled out the tube and stuffed a replacement in, had to wedge a screwdriver handle under the tube stem so I could get the pump valve far enough on to actually push air into the tube, that only took a half dozen tries. When I used to bike to work in Minneapolis I would have at least 10 flats yearly, bought tubes 4 at a time, got extremely efficient at changing tubes. Biked 9-10 months a year for 27 years in any weather; rainstorms, snow, cold - down to 25F, that required a headband to keep my ears from freezing, also had to put a rain cover on my helmet to keep the freezing air from my bald head.  All that exercise probably helped me survive the stroke.

Putting the seat on with its' two support tubes at the same time takes at least 15 minutes, then another 10 minutes to get the holes lined up to push the pin clips through. A two handed person would get that whole thing done in 2 minutes. 

You have to get both posts going at the same time. I'm using the most upright position.  You'd practically be lying down at the lowest position. 

The pin clips for the seat posts


The biking glove for the right hand requires using my teeth to pull the glove completely on. Taking it off requires each individual stub of the fingers to be pulled by my teeth one at a time in order. 

My ex used to criticize me for using my teeth to accomplish what needs to be done. I never listened to her criticisms of my rehab even though she was a PT. 

Yesterday was 8.43 miles in 1:22. Avg. speed; 6.1 mph. Max speed 13.8 mph. Elevation loss; 231.3 feet. Elevation gain; 145.7(That doesn't make sense since I started and ended at the same place.) 9.8 min/mi.  Zeopoxa cycling app. 

Today was 8.17 miles in 1:05. Avg. speed; 7.5 mph. Max speed 13.9 mph. Elevation loss; 118.8 feet. Elevation gain; 112.5(Just a slightly different route.)8.0 min/mi.

Had to tighten down the two pins holding the seat in place, otherwise in tight turns it feels like tipping over.  At high speed you really have to pay attention, it feels like the trike is kinda floating around you. 

 Not sure how fast I can get this going. On an old bicycle going down a steep hill I hit 39 mph, that was scary.

Haven't quite figured out what I need to do when biking in the rain, the rear wheel might just spray the back of my head in a continuous shower.

This is fun, finally getting a breeze in my face again under human power.

Sunday, August 2, 2020

Worse Multisensory Function May Accelerate Cognitive Aging

You are already in a cognitive hole from your stroke, what is your doctor's testing strategy and protocols for cognitive recovery?  Don't let your doctor dig a deeper hole and leave you down there.

You lost 5 cognitive years from the stroke.


Worse Multisensory Function May Accelerate Cognitive Aging


HealthDay News — Worsening multisensory function is associated with accelerated cognitive aging, according to a study published online July 12 in Alzheimer’s & Dementia.
Willa D. Brenowitz, Ph.D., M.P.H., from the University of California in San Francisco, and colleagues enrolled 1,794 adults aged 70 to 79 years who were dementia-free and followed them for up to 10 years to examine the association between multisensory impairment and dementia. The multisensory function score was based on sample quartiles of objectively measured vision, hearing, smell, and touch summed overall. In models adjusting for demographics and health conditions, the risks for incident dementia and cognitive decline associated with the score were assessed.
The researchers found that comparing poor and good multisensory score tertiles and comparing middle and good tertiles, dementia risk was 2.05 and 1.45 times higher, respectively. Faster rates of cognitive decline were seen in association with each point worse in the multisensory function score.
“This study adds to emerging evidence that multisensory impairment, even at mild levels, is associated with accelerated cognitive aging,” the authors write. “Multisensory assessments may be a useful important risk-stratification tool to identify those at high risk for accelerated cognitive aging and other poor health outcomes.”


Continue Reading
Abstract/Full Text (subscription or payment may be required)

Neurorobotic and hybrid management of lower limb motor disorders: a review

In the past 9 years, DID YOUR HOSPITAL DO ONE DAMN THING WITH THIS? Or did the board of directors allow the cesspools of incompetence to infect the whole hospital?  Why would you want to go to a hospital that DOES NOTHING with stroke research? 

Neurorobotic and hybrid management of lower limb motor disorders: a review

  Received: 22 February 2011/Accepted: 30 July 2011

 International Federation for Medical and Biological Engineering 2011

Abstract

 A neurobot (NR) is a mechatronic wearable robot that can be applied to drive a paralyzed limb.Through the application of controllable forces, a NR can assist, replace, or retrain a certain motor function. Robotic intervention in rehabilitation of motor disorders has a potential to improve traditional therapeutic interventions.Because of its flexibility, repeatability and quantifiability, NRs have been more and more applied in neurorehabilitation. Furthermore, combination of NRs with functional electrical stimulation/therapy constitutes a trend to over-come a number of practical limitations to widespread the application of NRs in clinical settings and motor control studies. In this review, we examine the motor learning principles, robotic control approaches and novel developments from studies with NRs and hybrid systems, with a focus on rehabilitation of the lower limbs.

Introduction

Loss of motor function is a hallmark consequences of neurological diseases. A study compiles the 12 most common neurological diseases in the U.S. Among them,those neurological diseases that can affect lower limb motor function are cerebral palsy in children, sclerosis,Parkinson, Stroke, amyotrophic lateral sclerosis, and spinal cord injury (SCI). Estimated prevalence for cerebral palsy was 2.4 per 1,000 children. In the general population, per1,000, the 1-year prevalence for multiple sclerosis was 0.9.Among the elderly, the prevalence of Parkinson disease was 9.5. For diseases best described by annual incidence per 100,000, the rate for stroke was 183,101 for major traumatic brain injury, 4.5 for spinal cord injury, and 1.6for amyotrophic lateral sclerosis [45]. Some others studies have been focused on one of those neurologic diseases, the ones with more incidence. For example, stroke prevalence has been estimated in other review in 2.9%, estimating that a new stroke attack occurs every 40 s [28]. Another study done in SCI showed that world annual incidence rates intraumatic SCI varied from 12.1 to 57.8 per million [94]. In the case of Parkinson disease, the world incidence has been established in 10–18 cases per million, with a prevalence of among 0.3–3% [35], mainly in the elderly population.Neurologic motor rehabilitation is directed toward there-learning of motor skills. Behavioral experience can cause dendrites to grow and regress, synapses to change inefficacy, vasculature and glia to be modified, and, some-times, neurons to be added or lost [56]. Task-oriented repetitive movements can improve muscular strength and movement coordination in patients with impairments dueto neurological disorder that leads to motor control abnormalities, weakness and spasticity. During the last decades, there is a trend in rehabilitation practices among practitioners that focus on the functional movements torecover gait [62, 95]: task specific physiotherapy (standing on parallel bars, training of equilibrium), bracing, manual supported over ground gait training, manual body weight supported treadmill training and robotic treadmill training,among others.

Turning-Based Treadmill Training Improves Turning Performance and Gait Symmetry After Stroke

 Since nothing was done with this from 6 years ago.  Why don't you ask your board of directors why nothing was done and incompetence was allowed to fester and never will be fixed until survivors run things.

The latest here:

Turning-Based Treadmill Training Improves Turning Performance and Gait Symmetry After Stroke

 2014, Neurorehabilitation and Neural Repair
 I-Hsuan Chen, PhD 1, 
Yea-Ru Yang, PhD 1,2, 
Rai-Chi Chan, MD 3, 
and Ray-Yau Wang, PhD 1

Abstract

Background
. Turning is a challenging task for stroke patients. Programs that effectively target turning, however, have not been established.
Objective
. This study examined the effects of a novel turning-based treadmill training on turning performance, gait symmetry, balance, and muscle strength in patients with chronic stroke.
 Methods
. Thirty participants were randomly assigned to the experimental group that received 30 minutes of turning-based treadmill training or to the control group that received 30 minutes of regular treadmill training, followed by a 10-minute general exercise program for 12 sessions over 4 weeks. Primary outcomes (overground turning speed and temporal–spatial characteristics of straight walking) and secondary outcomes (balance and muscle strength) were assessed at baseline, after training, and at 1-month follow-up.
Results
. Fifteen participants per group were 54.2± 9.6 years old, poststroke 2.6± 1.9 years, and walked overground at 0.59± 0.28 m/s. Sixteen had an ischemic and 14 a hemorrhagic stroke. There were significant interaction effects between groups and time on turning speed regardless of turning direction, straight-walking performance (speed and temporal symmetry), strength of hip muscles and ankle dorsiflexors, and balance control (Berg Balance Scale, weight shifting in the forward direction and vestibular function). Compared with the control group, the experimental group showed greater improvements in these measures following training. These improvements persisted at the 1-month follow-up evaluation.
Conclusions
. Turning-based treadmill training may be a feasible and effective strategy to improve turning ability, gait symmetry, muscle strength, and balance control for individuals with chronic stroke.

 Introduction

Gait recovery is critical for individuals who have suffered a stroke.1
Approximately two thirds of stroke patients eventually walk with or without assistance1.
However, many individuals still exhibit hemiplegic gait patterns and cannot achieve the walking dexterity required for all activities of daily living. Advanced gait training programs have there-fore been emphasized in recent years, including dual-task training2, obstacle crossing in a virtual reality environment3,4, and robotics-assisted practice of stair climbing5. Up to 40% of all steps taken in everyday walking are turns6. Turning requires the central nervous system to coordinate whole-body reorientation toward a new travel direc-tion7. Balance maintenance during turning involves complex integration of multiple sensory systems (vestibular, visual, somatosensory) and motor output8.

 Moreover, there are increased medial–lateral impulses during turning as compared with straight walking9. The outer limb requires relatively greater activation of the ankle dorsiflexors during the swing phase and greater activation of the ankle plantar flexors during the stance phase to provide body propulsion. The inner limb requires increased extensor muscle activity to generate supportive action and to maintain whole-body stability in the stance phase10. Turning is often compromised in individuals with stroke and is one of the most frequent activities leading to falls within this population11. Following stroke, individuals demonstrate inadequate propulsion and weight shifting, along with insufficient extensor and ankle dorsiflexor strength12-14. Abnormally large and disrupted sequences of gaze, head,  and body motion because of deficits in sensorimotor integration have also been observed during turning15.

 Kobayashi et al16 reported that patients with hemiplegia had difficulty walking along curvilinear paths. Recent studies also suggest that these patients turn more slowly because of the absence of kinematic and muscular modulations in the affected leg17,18. Moreover, longer turn time were correlated with poor functional balance ability (indicated by Berg Balance Scale [BBS]) and temporal gait asymmetry17.As a result of these difficulties with turning, this activity has been indicated as a major target for gait rehabilitation19. Effective training programs specifically targeting turning characteristics, however, have not been established. Since motor learning involves repetition of desired movements (ie, specificity of training), “specific and repetitive” rehabilitation protocols that focus on turning may optimize turning-related outcomes20. We therefore hypothesized that a novel treatment turning based treadmill training would lead to greater improvement in turning performance as compared with regular treadmill training in subjects with chronic stroke. In addition, as turning requires side-specific muscle modulation of the lower limbs and medial–lateral  balance control18,
we hypothesized that the turning-based treadmill training would improve gait symmetry during straight walking, muscle strength of the lower extremities and standing balance.

Actual description of treadmill at link. 

Acupuncture effective in COVID-19 recovery

Impossible to have effects except as a placebo. Energy meridians have never been proven to exist.
No mechanism of action is possible. 

But if you believe, have at it, recognizing these possible side effects;

 The latest here:


Acupuncture effective in COVID-19 recovery

As patients recover from Covid-19, there are multiple issues they suffer.
Published: 02nd August 2020 05:00 AM  |   Last Updated: 01st August 2020 04:54 PM   |  A+A-

Acupuncture
For representational purposes
As patients recover from Covid-19, there are multiple issues they suffer. The commonest ones persisting even after two weeks of testing negative are:
1. Cough with a sore throat
2. Fatigue
3. Post-Covid-19 lung disease
4. Anxiety, depression, insomnia
5. Cognitive issues similar to moderate traumatic brain injury
6. Digestive problems like bloating, imitable bowel, nausea and vomiting, abdominal pain
The problem of persistent cough after recovering from a Covid-19 attack is common. Acupuncture is found to be 90 percent effective in such cases without side effects. Patients will typically complain of dry cough, throat irritation and scanty white phlegm. In the acupuncture group, patients were needled at Lu.10, Lu.1, Lu.5, Lu.6, Lu.7, ST.25, ST.36 and T.40. The total treatment sessions were s10 and each session was 30-minute long.
In the medication group, patients were given Methoxyphenamine capsules thrice a day for 10 days and the success rate was 700 percent. Patients develop fatigue following Covid-19 illness due to the depletion of their Qi because of hypoactivity of the Hypothalamic-pituitary axis. Acupuncture was given at selected acupoints P.6, ST.36, SP.6, Liv.3, Ren.4, Du.20, Ub.23 for five days in a week for two weeks, and 80 percent patients showed improvement in fatigue levels. After getting Covid-19, lung disease can be effectively tackled using acupuncture and moxibustion. The principle is to promote, regulate, and stimulate the body’s self-regulating function. Most of these patients have symptoms similar to COPD due to damage to lung parenchyma caused by pneumonitis. 
Anxiety, depression and insomnia are common in such patients and these can be effectively tackled by stimulating specific acupoints which release melatonin and the happy hormone, serotonin. Many patients who have recovered from Covid-19 illness complain of a lingering cognitive impact—problems with their memory and inability to stay focussed. This is caused due to the body’s response to infection which leads to blood becoming extremely sticky. This is particularly seen in patients who stayed in the ICU.
Early studies on this problem have shown that acupuncture given at points LI.4, Li.11 DU.20, ST.36, ST.40, GB.34 shishencong, P.6, H.7, Du.16, Liv.3, improved cognitive ability. Treatment was given over four weeks, five days a week, for a 30-minute session. Post Covid-19, digestive symptoms such as nausea and vomiting, loss of appetite, bloating, abdominal pain and irritable bowel persist. Patients were given acupuncture thrice a week for four weeks.
The major cause of these symptoms is the impact on the spleen, stomach, and the liver. Acupuncture promotes gastric peristalsis in subjects with low-intensity gastric motility and suppresses peristalsis in those with acute initial motility. Almost 70-80 percent patients showed improvement in their symptoms with acupuncture, which is a safe, efficacious treatment without any side effects.
The author is Head of the Department of Acupuncture, Sir Ganga Ram Hospital, Delhi(So a totally biased article.)

An update on predicting motor recovery after stroke

This is pretty much totally fucking useless. Predicting the current minimal recovery does no one any good. Now if you had 100% recovery protocols then your patients would be happy and do whatever was necessary to recover. Including 10 million repetitions.   This totally assumes that survivors are OK with the tyranny of low expectations your stroke medical team is pushing.  FUCKING NOT OK!

Oops, I'm not playing by the polite rules of Dale Carnegie,  'How to Win Friends and Influence People'. 

Politeness will never solve anything in stroke. Yes, I'm a bomb thrower and proud of it. Someday a stroke 'leader' will ream me out for making them look bad by being truthful , I look forward to that day. 

The latest here:


An update on predicting motor recovery after stroke

2014, Annals of physical and rehabilitation medicine
Literature review/Revue de lalitte´rature
An update on predicting motor recovery after stroke
 Nouveaute´ s surlare´ cupe´ rationmotriceapre`s AVC
C.M.Stinear a,b,*,1,W.D.Byblow b,c,1,
S.H.Ward c 
a Clinical Neuroscience Laboratory, Department of Medicine, University of Auckland,
 Private Bag, 92019 Auckland, New Zealand
b Centre for Brain Research, University of  Auckland,
 Private Bag, 92019 Auckland, New Zealand
c Movement Neuroscience Laboratory, Department of Sport and Exercise Science, University of Auckland,
 Private Bag, 92019 Auckland, New Zealand
Received 9 August 2014;accepted 9 August 2014

Abstract

Being able to predict an individual’s potential for recovery of motor function after stroke may facilitate the use of more effective targeted rehabilitation strategies, and management of patient expectations and goals.(Wrong, wrong, wrong. You're using the tyranny of low expectations to justify YOUR FAILURE to have 100% recovery protocols. DAMN YOU ALL TO HELL.)This review summarises developments since 2010 of approaches based on clinical, neurophysiological and neuroimaging measures for predicting individual patients’ potential for upper limb recovery. Clinical assessments alone have low prognostic accuracy. Transcranial magnetic stimulation can be used to assess the functional integrity of the corticomotor pathway, and has some predictive value but is not superior when used in isolation due to its low negative predictive value. Neuroimaging measures can be used to assess the structural integrity of descending white matter tracts. Recent studies indicate that the integrity of corticospinal and alternate motor tracts in both hemispheres may be useful predictors of motor recovery after stroke. The PREP algorithm is currently the only sequential algorithm that combines clinical, neurophysiological and neuroimaging measures at the subacute stage to predict the potential for subsequent recovery of upper limb function. Future research could determine if a similar algorithmic approach may be useful for predicting the recovery of gait after stroke.
# 2014 Elsevier Masson SAS. All rights reserved. 

New Chest Imaging Guidance on COVID-19 from the World Health Organization

This is after the diagnosis of COVID-19, way too late in the game.  What is needed is EXACT PROTOCOLS THAT PREVENT COVID-19 SEQUELAE AS SOON AS YOU ARE DIAGNOSED.  


Maybe these? You can't use them because I'm not medically trained.


I'm going to be asking for heparin as a blood thinner because of this:

Common FDA-approved drug may effectively neutralize virus that causes COVID-19

Or this?

CBD may help avert lung destruction in COVID-19

Or this?

Potential therapeutic use of ebselen for COVID-19 and other respiratory viral infections


This following problem needs to be solved by EXACT PROTOCOLS FROM YOUR DOCTOR.

High cortisol levels associated with greater risk of death from COVID-19, levels are high after stroke

Are these in your doctors protocol and are they fast enough?

13 proven natural ways to lower cortisol - Medical News Today

 And this from autopsy findings;

Another takeaway is that the findings underscore the importance of getting people on supplementary oxygen quickly to prevent irreversible brain damage. 

Oxygen uptake, maybe these?

Sesquiterpenes, a natural compound found in essential oils of Vetiver, Patchouli, Cedarwood, Sandalwood and Frankincense, can increase levels of oxygen in the brain by up to 28 percent 

Or this?

University of Glasgow Study Demonstrates the Ability of Oxycyte® to Supply Oxygen to Critical Penumbral Tissue in Acute Ischemic Stroke  

Or this? having red blood cells release more oxygen.

Methylene blue shows promise for improving short-term memory

The latest here: 

New Chest Imaging Guidance on COVID-19 from the World Health Organization


July 31, 2020
A team of international experts published seven recommendations for the use of chest imaging in the diagnosis and management of COVID-19-positive patients.

The World Health Organization (WHO) has published new rapid guidance for using chest imaging for diagnosing and managing patients who test positive for COVID-19.
For two months, international experts shared their knowledge and experience via online meetings and reviews. The result is a concise list of recommendations on how providers can best evaluate the how acceptable, feasible, and effective chest X-ray, chest CT, and lung ultrasound will be in addressing COVID-19.
The team published their guidance in the journal Radiology on July 30.
For diagnosis, the team made three recommendations:
  1. Chest imaging does not offer diagnostic accuracy for asymptomatic COVID-19 patients, and use is not suggested.
  2. Choose RT-PCR, when available and time-effective, over chest imaging in symptomatic COVID-19 patients.
  3. Chest imaging can be used with symptomatic patients in two instances: when the RT-PCR test is either unavailable or results are delayed and when initial RT-PCR results are negative, but there is a high clinical suspicion of COVID-19.
The team made four additional recommendations for chest imaging with patient management:
  1. For patients with suspected or confirmed COVID-19 who have mild symptoms, use chest imaging – alongside lab assessments – to decide between a hospital admission or home recovery.
  2. For patients with confirmed infection and moderate-to-severe symptoms, pair imaging with lab assessments to decide between regular ward or intensive care unit admission.
  3. For hospitalized patients with suspected or confirmed infection and moderate-to-severe symptoms, use chest imaging with lab assessments to inform therapeutic management.
  4. Do not use chest imaging in hospitalized patients whose symptoms have resolved to make a decision regarding discharge.
The team did note that these recommendations were conditional, were based on low-to-very low certainty findings culled from existing studies, and were directed at chest imaging overall rather than specific modalities. Additionally, they said, there is a continual need for more evidence about the diagnostic and prognostic value of imaging modalities in the management of the pandemic.

Saturday, August 1, 2020

Contralesional Motor Cortex Activation Depends on Ipsilesional Corticospinal Tract Integrity in Well-Recovered Subcortical Stroke Patients

Useless. You don't tell us how to get Contralesional Motor Cortex Activation. This prediction just follows the existing failures in stroke recovery. DO YOU THINK ANY STROKE SURVIVOR CARES THAT YOU ARE PREDICTING FAILURE TO RECOVER?  Are you that fucking stupid?  This has the crapola of motor evoked potentials and biomarkers, none of which survivors give a rats' ass about.

Contralesional Motor Cortex Activation Depends on Ipsilesional Corticospinal Tract Integrity in Well-Recovered Subcortical Stroke Patients

2012, Neurorehabilitation and Neural Repair
 Martin Lotze, MD 1, 
Willy Beutling 1, 
Moritz Loibl 1, 
Martin Domin 1, 
Thomas Platz, MD 2, 
Ulf Schminke, MD 1, 
and Winston D. Byblow, PhD 3

Abstract

Background.
 The relationship between structural and functional integrity of descending motor pathways can predict the potential for motor recovery after stroke.(And since only 10% fully recover, are you predicting the 90% failure rate or the outlier?) The authors examine the relationship between brain imaging biomarkers within contralesional and ipsilesional hemispheres and hand function in well-recovered patients after subcortical stroke at the level of the internal capsule.
Objective.
 Measures of functional activation and integrity of the ipsilesional corticospinal tract might predict paretic hand function.
 Methods.
 A total of 14 patients in the chronic stable phase of motor recovery after subcortical stroke and 24 healthy age-matched individuals participated in the study. Functional MRI was used to examine BOLD contrast during passive wrist flexion–extension and paced or maximum-velocity active fist clenching. Functional integrity of the corticospinal pathway was assessed by transcranial magnetic stimulation to obtain motor-evoked potentials (MEPs) in the first dorsal interosseus muscle of the paretic and nonparetic hands. Fractional anisotropy and the proportion of traces between hemispheres in the posterior limb of both internal capsules were quantified using diffusion-weighted MRI.
Results.
 Patients with smaller MEPs had a weaker paretic hand and more primary motor cortex activation in their affected hemisphere.

Asymmetry between white matter tracts of either hemisphere was associated with reduced precision grip strength and increased BOLD activation within the contralesional dorsal premotor cortex for demanding hand tasks.
Conclusion.
 There may be beneficial reorganization in contralesional secondary motor areas with increasing damage to the corticospinal tract after subcortical stroke. Associations between clinical, functional, and structural integrity measures in chronic stroke may lead to a better understanding of motor recovery processes. (So you learned nothing in your research that can help survivors?)

Stroke With COVID-19? Check the Large Vessels

Useless. This is determining after the fact, the stroke has already occurred. WHAT THE FUCK IS NEEDED TO PREVENT SUCH STROKES? As soon as you are diagnosed with COVID-19 we need a protocol to prevent these clot complications and strokes. WHAT IS IT?

Stroke With COVID-19? Check the Large Vessels

Observational study suggests distinct difference in presentation

by Crystal Phend, Senior Editor, MedPage Today
A computer rendering of the human brain with a light radiating from the center of it representing a stroke over coronaviruses
COVID-19's excess stroke risk appeared to be largely related to large vessel strokes, an observational study showed.
Among stroke code patients at one large health system in New York City during the pandemic surge there, 38.3% had COVID-19 (126 of 329 seen from March 16 to April 30, 2020).
Large vessel occlusion (LVO) as a cause of the stroke was 2.4-fold more common with COVID-19 than without it after adjustment for race and ethnicity (P=0.011), Shingo Kihira, MD, of Icahn School of Medicine at Mount Sinai in New York City, and colleagues reported in the American Journal of Roentgenology.
Of the stroke cases, 31.7% of those in COVID-19 patients were LVOs compared with 15.3% in those without COVID-19 (P=0.001). But there was not much difference between groups for small vessel occlusions (SVOs), at 15.9% and 13.8%, respectively (P=0.632).
"Physicians should lower their threshold of suspicion for large vessel stroke in patients with COVID-19 who present with acute neurologic symptoms," the researchers concluded, recommending prompt workup.
"Health care providers in the emergency department and inpatient areas should be cognizant of this association and not delay activating a stroke code," they wrote.
Notably, the most common location for the LVO strokes was middle cerebral artery segments M1 and M2 (62.0% [44 of 71 cases]), which are potentially candidates for mechanical thrombectomy.
"This association may aid neurointerventionalists assessing the presence and location of an LVO if they are aware of this elevated risk in the COVID-19 population," Kihira's group pointed out.
Also, for LVOs seen during the COVID-19 pandemic, it might be worth taking extra personal protective equipment and infection control precautions for patients who have not been tested for SARS-CoV-2 infection or are waiting for results, they added.
All patients with LVO are already currently treated as possibly having COVID until infection is ruled out, commented Larry B. Goldstein, MD, of the University of Kentucky in Lexington, although only one at his center has yet tested positive "despite unchanged high volumes of patients with LVO having thrombectomy since the beginning of the pandemic."
The American Heart Association/American Stroke Association have urged physicians to follow standard guidelines for stroke care during the pandemic when possible in terms of patient selection for therapy, treatment times, and monitoring after recanalization.
However, its temporary guidance noted that "in the setting of the pandemic full compliance has become a goal, not an expectation" and pointed to things that may help in the face of shortages in staff, personal protective equipment, and medical equipment.
One notable difference in care for LVO patients found to be SARS-CoV-2 positive is that they should have a more extensive evaluation for abnormal clotting, Goldstein said.
Strokes and coagulopathy have been noted with COVID-19, although the researchers said they couldn't determine causality for the link between LVO and the virus with their retrospective observational study.
Why LVO might be more common than SVO with COVID-19 isn't clear, but it's an area of active investigation, Kihira told MedPage Today.
The retrospective study included all 329 patients for whom a code for stroke was activated (53% men, mean age 67) out of the total 9,814 patients (5,862 with COVID-19) during the study period at the Mount Sinai system's six hospitals. Among these patients, 35.3% had acute ischemic stroke confirmed with imaging; 21.6% (71) had LVO; and 14.6% (48) had SVO.
The only stroke-related predictor of COVID-19-positive status was Hispanic ethnicity. This group accounted for 38.1% of patients with COVID-19 versus 20.7% of those without (P=0.001).
Disclosures
The researchers disclosed no relevant relationships with industry.

Brain death evaluation during the pandemic

If you present to a hospital with locked-in-syndrome you better hope this is known about and followed.

How Should Doctors Determine Brain Death? January 2019

AAN calls for uniform, guideline-based policies and practices

The latest here:

Brain death evaluation during the pandemic

Ibrahim Migdady, Alexander Rae-Grant, David M. Greer

Abstract

Coronavirus Disease 2019 (COVID-19) may pose unique challenges to clinicians attempting to diagnose brain death in patients infected with the SARS-CoV-2. Among these challenges is the risk of aerosol generation during the traditional apnea testing using the insufflation technique, in addition to the risk of complications due to SARS-CoV-2-related lung disease. In this article, we discuss these challenges and provide further guidance to minimize such risks in order to ensure safety of health care professionals and other patients. We also emphasize the importance of maintaining the standards of brain death determination in this critical time.
  • Received June 5, 2020.
  • Accepted in final form July 21, 2020.

Hyperdense vessel sign as a potential guide for the choice of stent retriever versus contact aspiration as first-line thrombectomy strategy

Where the fuck is the preliminary protocol on this while you lazily didn't do your job well enough and had to call for further studies?

Hyperdense vessel sign as a potential guide for the choice of stent retriever versus contact aspiration as first-line thrombectomy strategy


Download PDFPDF

  1. Mahmoud H Mohammaden1,2,
  2. Diogo C Haussen1,2,
  3. Catarina Perry da Camara1,2,
  4. Leonardo Pisani1,2,
  5. Marta Olive Gadea1,2,
  6. Alhamza R Al-Bayati1,2,
  7. Bernardo Liberato1,2,
  8. Srikant Rangaraju1,2,
  9. Michael R Frankel1,2,
  10. Raul G Nogueira1,2

Author affiliations


Abstract

Background The first-pass effect (FPE) has emerged as a key metric for efficacy in mechanical thrombectomy (MT). The hyperdense vessel sign (HDVS) on non-contrast head CT (NCCT) indicates a higher clot content of red blood cells.
Objective To assess whether the HDVS could serve as an imaging biomarker for guiding first-line device selection in MT.
Methods A prospective MT database was reviewed for consecutive patients with anterior circulation large vessel occlusion stroke who underwent thrombectomy with stent retriever (SR) or contact aspiration (CA) as first-line therapy between January 2012 and November 2018. Pretreatment NCCT scans were evaluated for the presence of HDVS. The primary outcome was FPE (modified Thrombolysis in Cerebral Infarction score 2c/3). The primary analysis was the interaction between HDVS and thrombectomy modality on FPE. Secondary analyses aimed to evaluate the predictors of FPE.
Results A total of 779 patients qualified for the analysis. HDVS and FPE were reported in 473 (60.7%) and 286 (36.7%) patients, respectively. The presence of HDVS significantly modified the effect of thrombectomy modality on FPE (p=0.01), with patients with HDVS having a significantly higher rate of FPE with a SR (41.3% vs 22.2%, p=0.001; adjusted OR 2.11 (95% CI 1.20 to 3.70), p=0.009) and non-HDVS patients having a numerically better response to CA (41.4% vs 33.9%, p=0.28; adjusted OR 0.58 (95% CI 0.311 to 1.084), p=0.088). Age (OR 1.01 (95% CI 1.00 to 1.02), p=0.04) and balloon guide catheter (OR 2.08 (95% CI 1.24 to 3.47), p=0.005) were independent predictors of FPE in the overall population.
Conclusion Our data suggest that patients with HDVS may have a better response to SRs than CA for the FPE. Larger confirmatory prospective studies are warranted.
View Full Text